
The XRP price has slipped about 4.7% this week, hovering near $2.80. At first glance, that may look like a normal correction after recent gains. But a deeper look at on-chain data tells a more revealing story: big investors are quietly exiting their positions — and fast.
Yet, despite the $130 million in sell pressure weighing on XRP, one technical indicator suggests a potential reversal could be brewing, if the token manages to hold a key support zone.
Whales and Long-Term Holders Hit the Exit
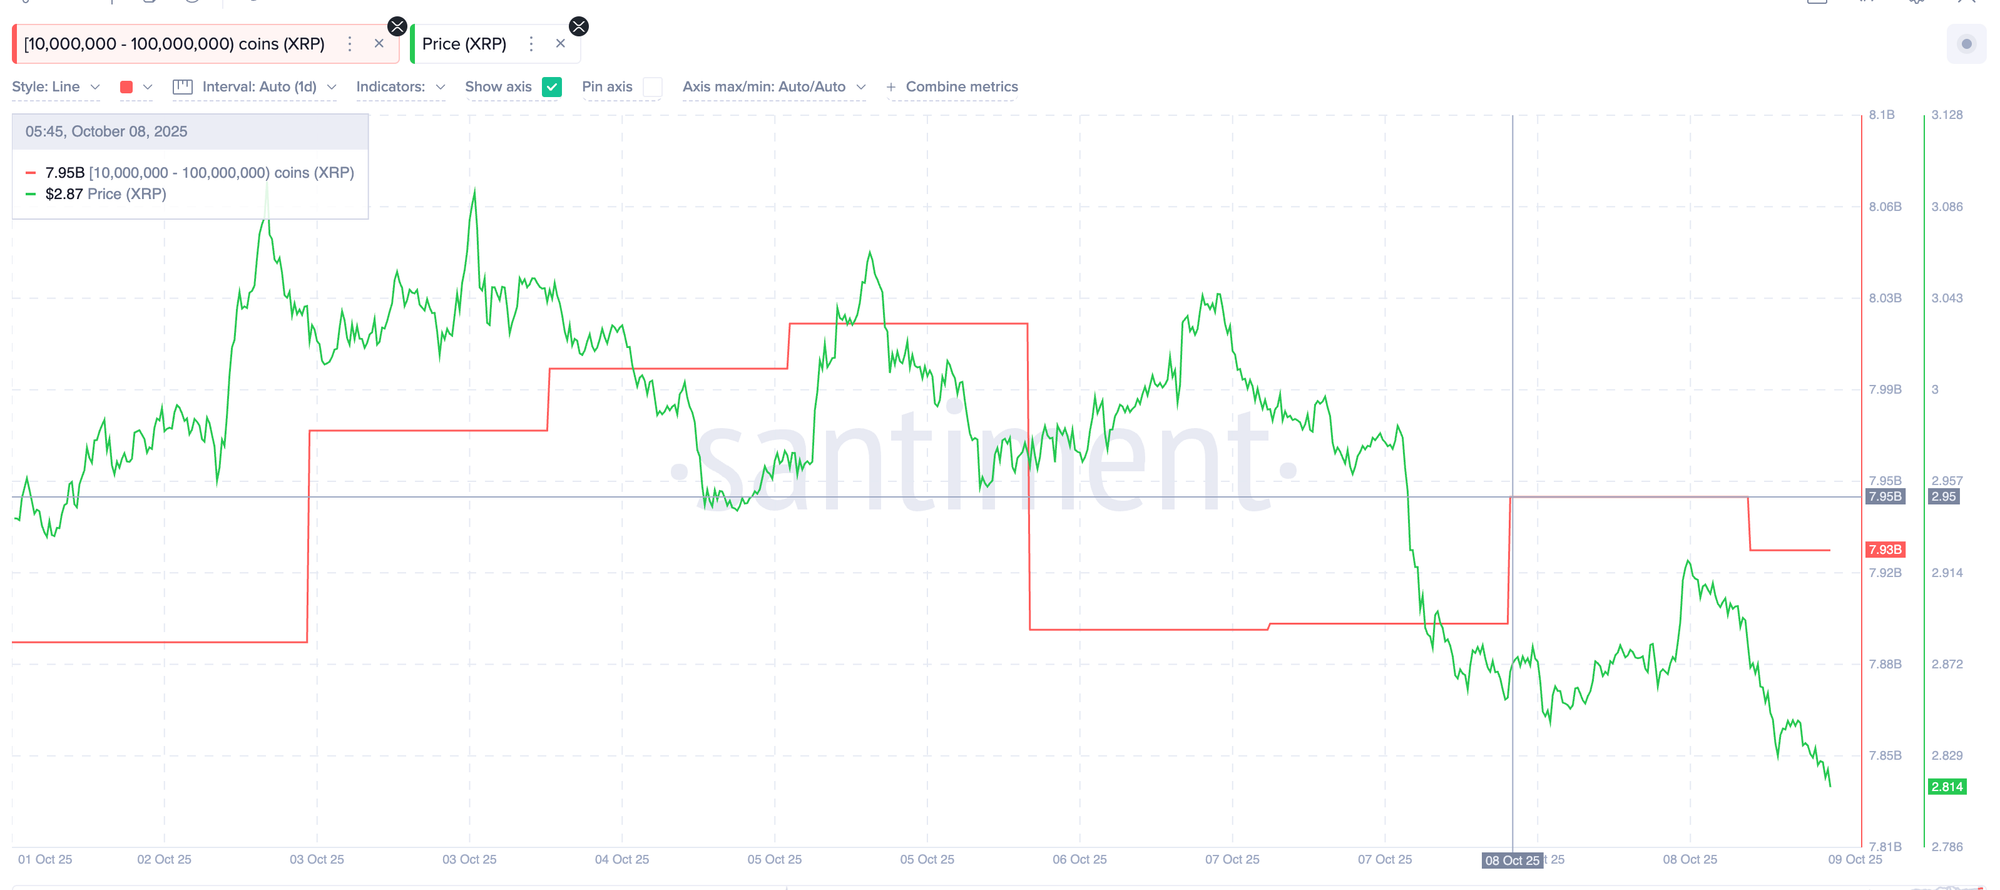
Over the past 24 hours, large XRP holders — wallets containing between 10 million and 100 million XRP — have cut their holdings from 7.95 billion to 7.93 billion tokens, according to Santiment data.
That 20 million XRP reduction equals roughly $56 million in value at current prices.
At the same time, long-term holders (HODLers) have also joined the sell-off. Glassnode data shows that since October 2, their combined holdings fell from 163.68 million XRP to 137.78 million XRP, a drop of about 25.9 million tokens — or roughly $72.5 million.
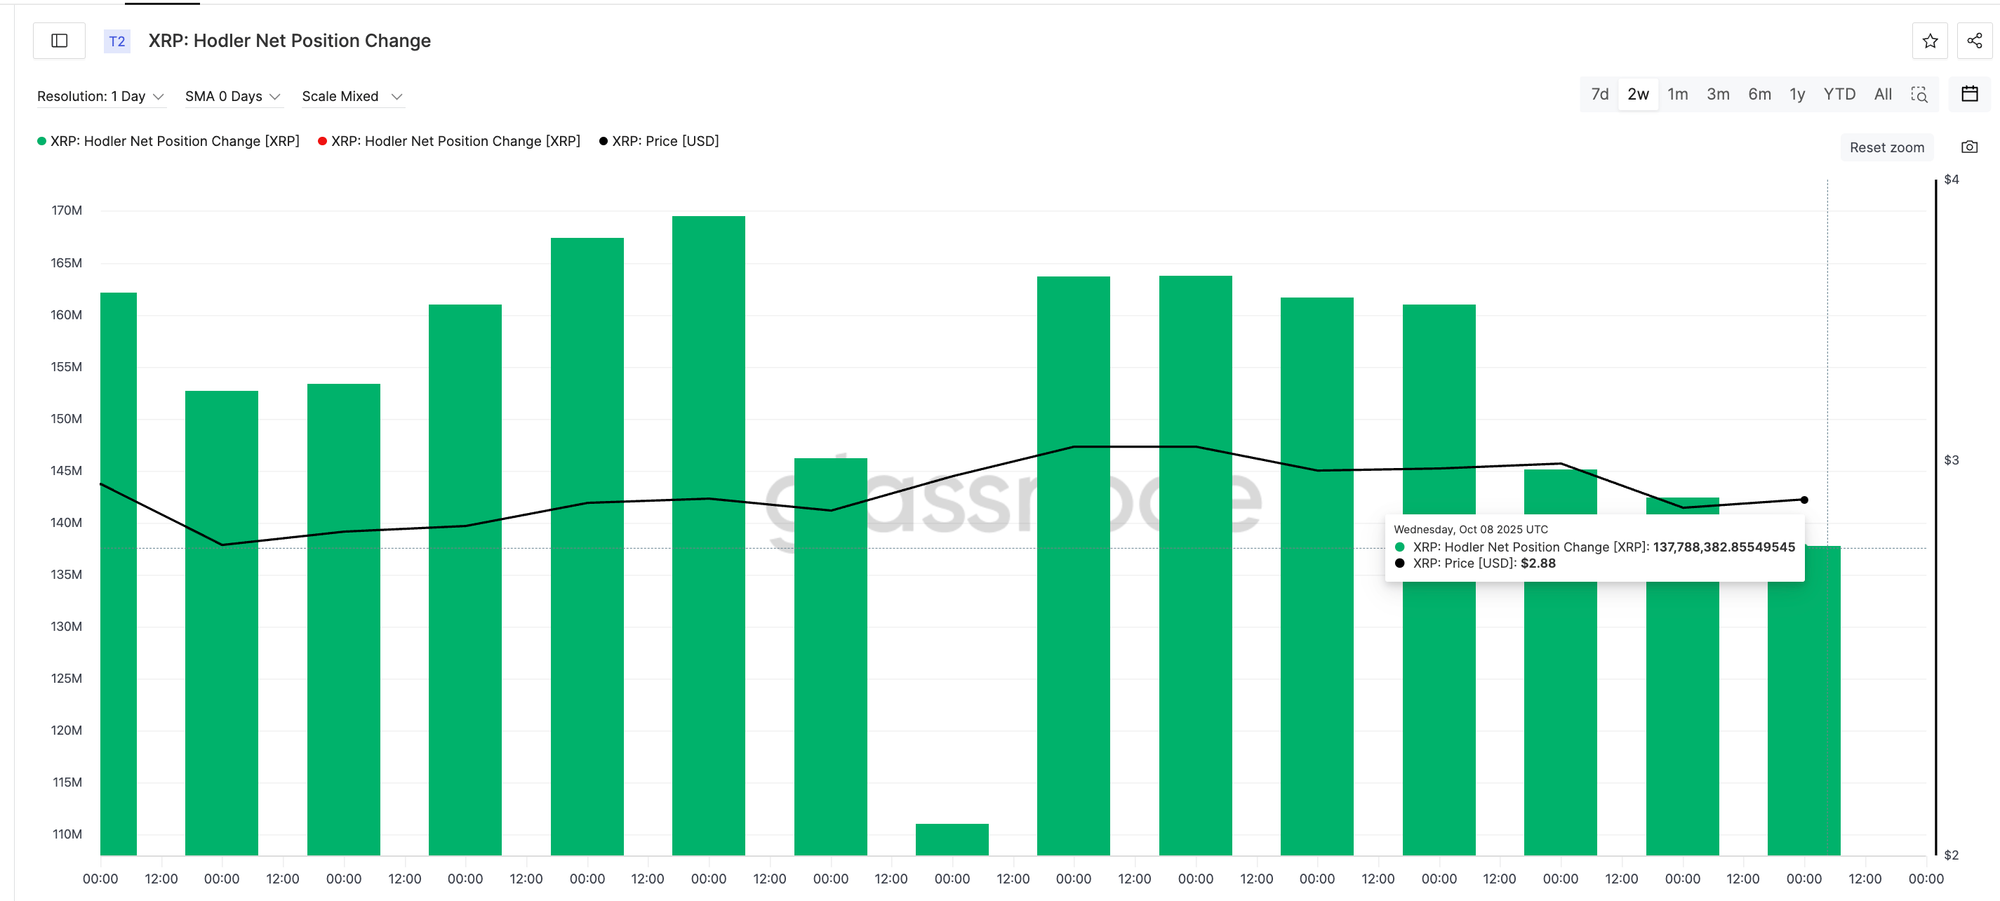
Put together, that’s around $130 million in selling pressure in under a week — and it tracks neatly with XRP’s 4.7% decline over the same period.
The data paints a clear picture: both whales and veteran holders are de-risking, likely taking profits or stepping aside amid short-term uncertainty.
Chart Signals: Bearish Setup Meets Hidden Bullish Divergence
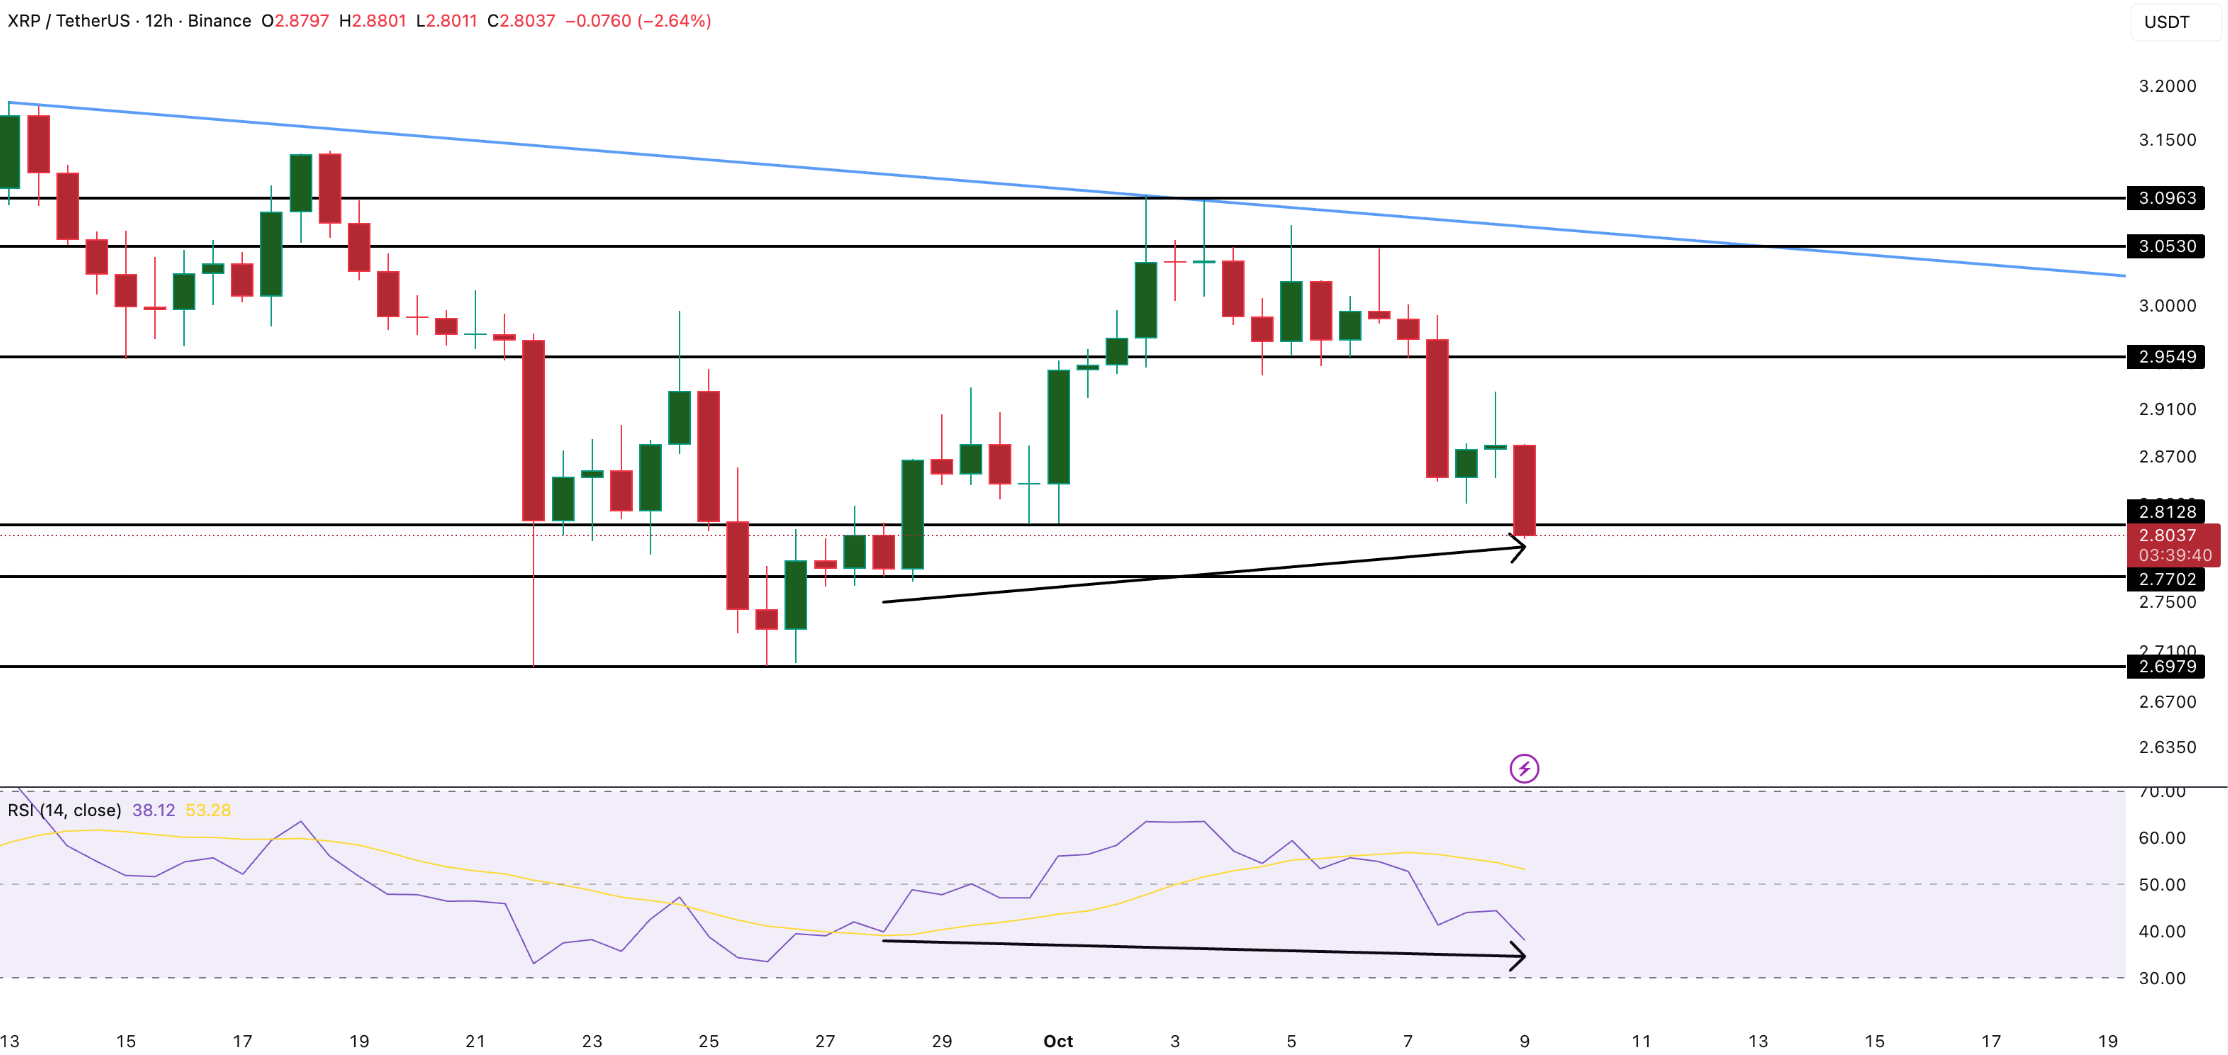
XRP’s 12-hour chart shows the token moving within a descending triangle pattern, a structure often seen before bearish continuations. The descending trendline continues to cap any attempts at recovery, suggesting sellers are still in control.
However, there’s one technical detail that’s keeping hope alive.
A hidden bullish divergence has formed — a signal that occurs when prices make higher lows even as the Relative Strength Index (RSI) makes lower lows. This pattern often suggests that underlying momentum is improving despite short-term weakness.
If XRP can hold above $2.77 — the low from September 27 — that divergence could confirm and spark a rebound toward $2.95 and possibly $3.09, where previous rallies hit resistance.
But if XRP closes below $2.77, that bullish scenario fades, and the price could slide toward $2.69 or lower.
XRP finds itself at a pivotal moment. On-chain data clearly shows whales and long-term holders pulling back, signaling caution across the board. But technical indicators hint that the worst might be over — if support holds.
In the near term, XRP traders are watching the $2.77 level like hawks. Lose it, and the market could see further downside. Hold it, and the next move might just surprise the bears.


