
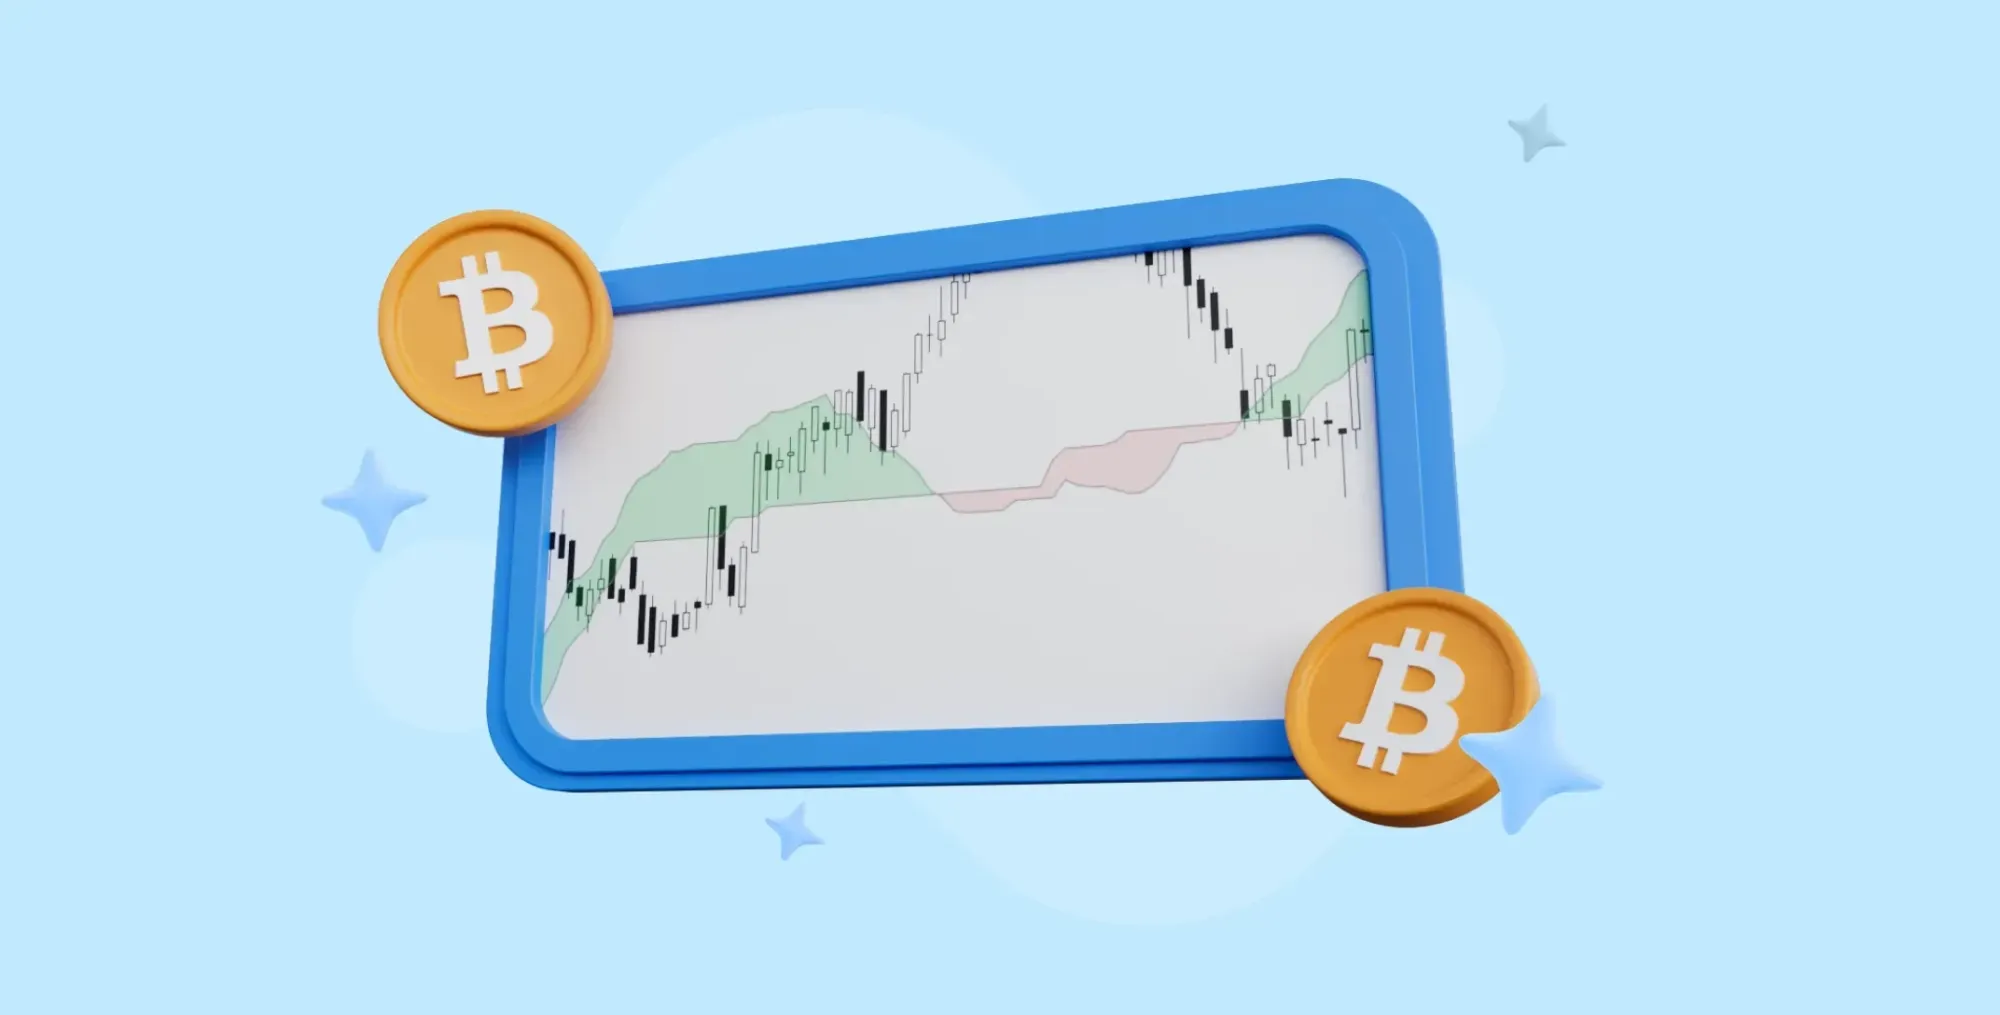
If you’ve spent any time looking at advanced trading charts, you’ve probably noticed the colorful, intricate indicator that looks like a cloud or fogbank hovering over the price action. That is the Ichimoku Kinko Hyo—or simply the Ichimoku Cloud.
Developed in the 1930s by Japanese stock analyst Goichi Hosoda (writing under the pseudonym Ichimoku Sanjin), this indicator is arguably one of the most powerful and comprehensive tools in technical analysis. Why? Because it’s not just one indicator; it’s five, all rolled into one chart, offering immediate visual cues for support, resistance, trend direction, and momentum.
While it may look intimidating, once you break down its five components, the "cloud" becomes much clearer.
The Five Pillars of the Ichimoku Cloud
The Ichimoku Cloud is designed to show you a lot of information in a single glance ("Ichimoku Kinko Hyo" roughly translates to "one look equilibrium chart"). It consists of four distinct lines and one shaded area:
| Component | Japanese Name | What It Is | Primary Function |
| Conversion Line | Tenkan Sen (Blue) | 9-period moving average. | Short-term momentum and minor signals. |
| Base Line | Kijun Sen (Dark Red) | 26-period moving average. | Mid-term trend confirmation and key support/resistance. |
| Lagging Span | Chikou Span (Light Green) | Current closing price projected 26 periods backward. | Confirmation of trend strength and potential reversals. |
| The Cloud | Kumo (Shaded Area) | The space between the two Leading Spans. | Major support/resistance and long-term trend direction. |
Settings for the Crypto Market
The original default settings (9/26/52/26) were based on the six-day trading week of the Japanese stock market. Since the cryptocurrency market operates 24/7, most professional crypto traders recommend adjusting the settings to: 20/60/120/30. This better reflects the continuous nature of digital asset trading and yields more reliable signals on higher time frames (like the 4-hour or 1-day charts).
The Cloud in Action: Reading the Kumo
The Kumo Cloud itself is the most important feature and is formed by the space between Senkou Span A (Leading Span A) and Senkou Span B (Leading Span B), both of which are plotted 26 periods into the future.
1. Trend Direction and Strength
The location of the price relative to the cloud instantly tells you the long-term trend:
- Bullish Trend: Price is trading above the Kumo Cloud. The cloud acts as a strong support level.
- Bearish Trend: Price is trading below the Kumo Cloud. The cloud acts as a strong resistance level.
- Sideways/Consolidation: Price is trading inside the Kumo Cloud.
2. Kumo Twists and Color
The color of the cloud predicts momentum:
- Green Cloud (Bullish Signal): Senkou Span A (the faster line) is above Senkou Span B (the slower line). This is generally a buy signal.
- Red Cloud (Bearish Signal): Senkou Span B is above Senkou Span A. This is generally a sell signal.
- Kumo Twist: When the cloud changes color, it's a Kumo Twist, signaling a potential future shift in the prevailing trend.
3. Kumo Breakouts
When the price breaks clearly out of the cloud and continues in that direction, it is a Kumo Breakout, confirming a powerful new trend direction. Conversely, a Kumo Edge-to-Edge setup occurs when the price breaks into the cloud, and traders aim to exit their position when the price hits the opposite edge of the cloud.
Reading the Lines: Entry and Exit Signals
While the cloud defines the large trend, the individual lines provide actionable, short-term signals.
The Kijun Sen (Base Line)
This line is a critical mid-term support/resistance indicator.
- Kijun Bounce: In a strong uptrend, when the price corrects and bounces off the Kijun Sen, it signals the strength of the uptrend and can be a good entry point.
- Kijun Cross: If the current asset price crosses above the Kijun Sen, it's a minor bullish signal. If the price crosses below it, it's bearish.
The Tenkan-Kijun Cross (TK Cross)
This is one of the most popular signals, acting much like a traditional moving average crossover. You simply watch the faster line (Tenkan Sen) crossing the slower line (Kijun Sen).
- Bullish TK Cross: The Tenkan Sen (blue) crosses above the Kijun Sen (red). This is strongest when it happens above the Kumo Cloud.
- Bearish TK Cross: The Tenkan Sen (blue) crosses below the Kijun Sen (red). This is an extremely bearish signal when it occurs below the Kumo Cloud.
The Chikou Span (Lagging Span)
This line is the simplest to calculate but often the last to be used, acting as a final confirmation tool. It's just the current closing price plotted 26 periods in the past.
- Confirmation: When the Chikou Span is trading above the current price action, it confirms a strong uptrend. When it is trading below the price action, it confirms a downtrend. If it crosses the current price candles, it can signal a trend reversal.
Mastering the Ichimoku Cloud takes patience and practice. Its signals are most reliable when the market is clearly trending, and less so during horizontal consolidation. When correctly interpreted, however, the Ichimoku Cloud gives a complete picture of market health, making it an indispensable tool for any serious trader.


