

On-chain data points to growing confidence among ASTER’s biggest investors. The top 100 wallets now hold around 7.84 billion ASTER, a 1.76% increase in just 24 hours—equivalent to roughly 134 million tokens worth about $264 million at current prices.
Publicly known wallets have also expanded their exposure by over 5%, adding nearly 236,000 ASTER (about $465,000).
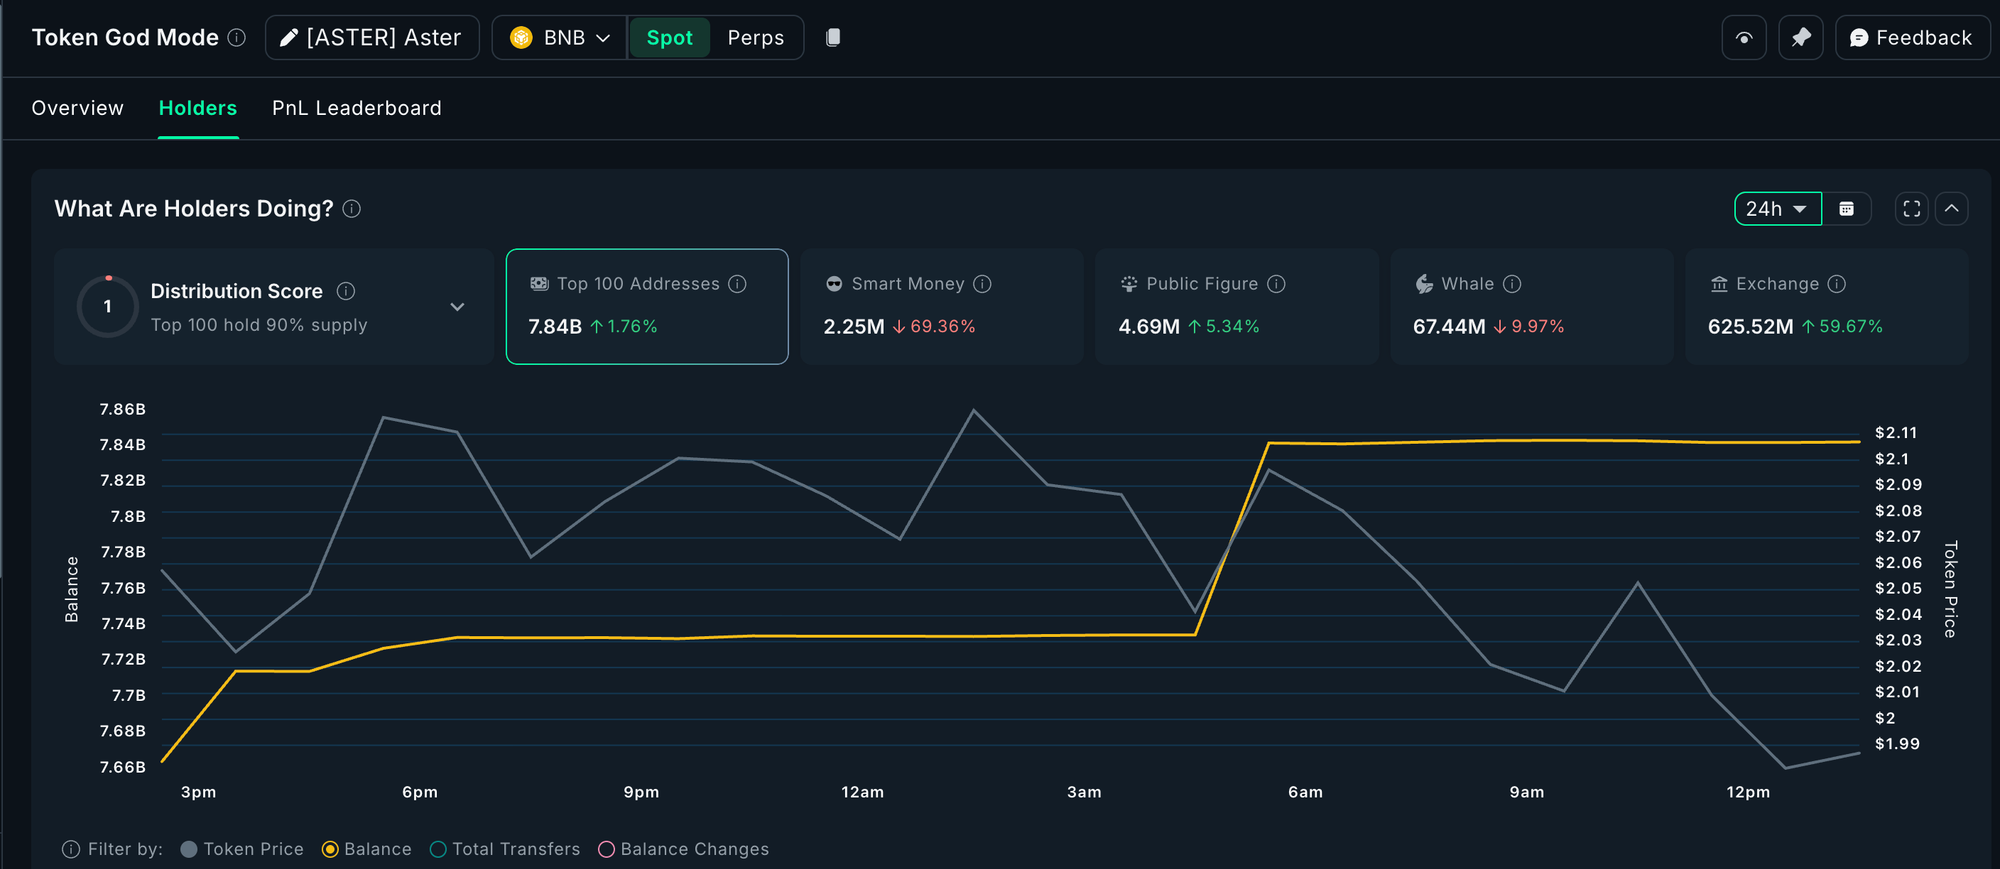
Not all wallets are piling in, though. “Smart money” addresses have reduced their positions by almost 70%, and broader whale wallets have trimmed about 7.5 million ASTER, or nearly $15 million worth of holdings.
At first glance, the 59.6% surge in exchange balances—to roughly 625 million ASTER—might look like aggressive selling. But analysts note that much of this movement likely reflects liquidity repositioning following ASTER’s Binance debut, not panic-driven exits.
Indicators Hint at Strength, Not Sell-Offs
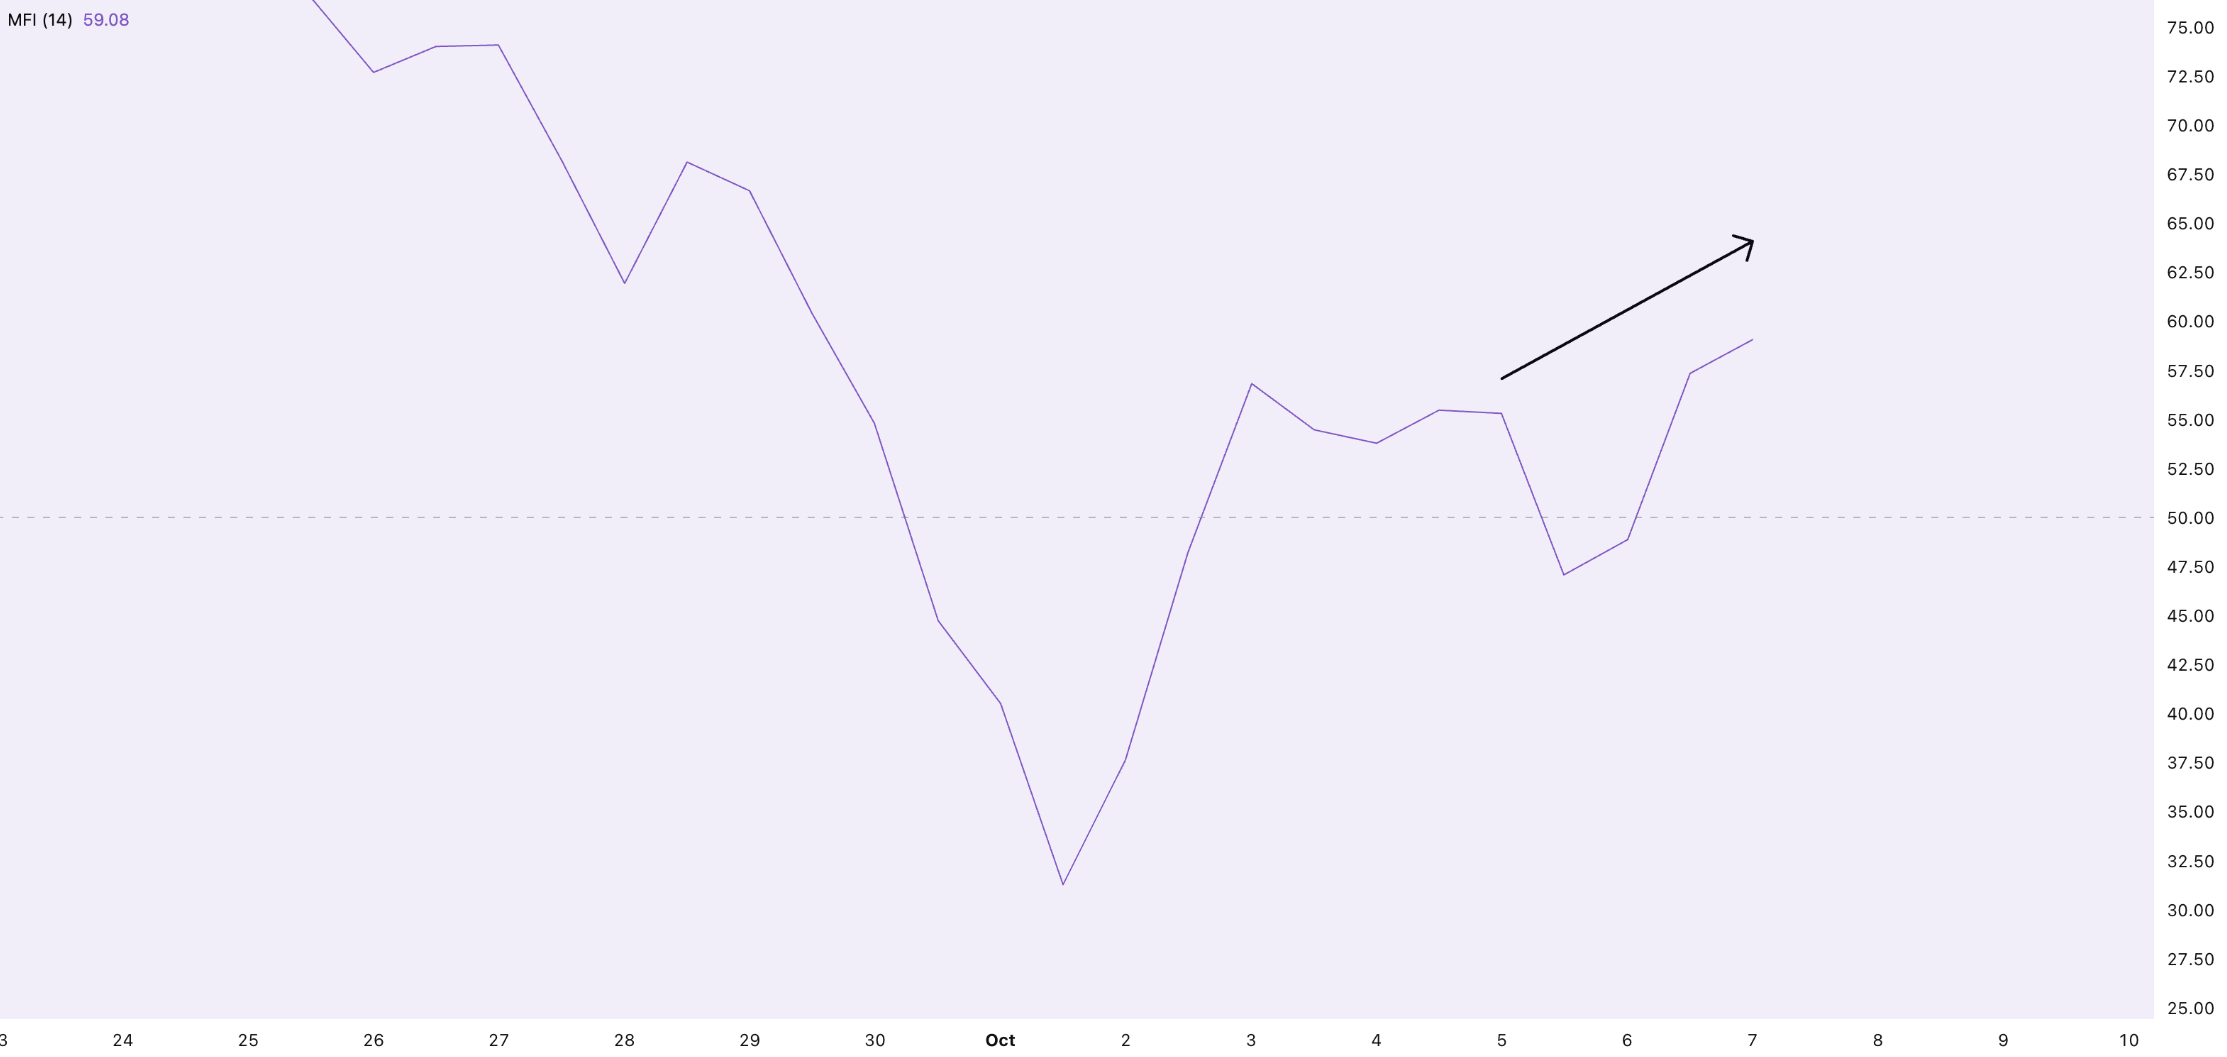
Supporting this view, the Money Flow Index (MFI)—which tracks buying and selling pressure—has continued to trend upward, moving toward the 65 level. Typically, if heavy selling were happening, the MFI would fall sharply. Instead, the uptick suggests new inflows and growing demand.
The Bull-Bear Power (BBP) indicator, which compares buying and selling momentum, also flipped green after October 5, signaling that bullish sentiment is back in control. Together, these indicators point to a healthy correction rather than a reversal, implying the so-called “selling pressure” might just be a liquidity illusion.
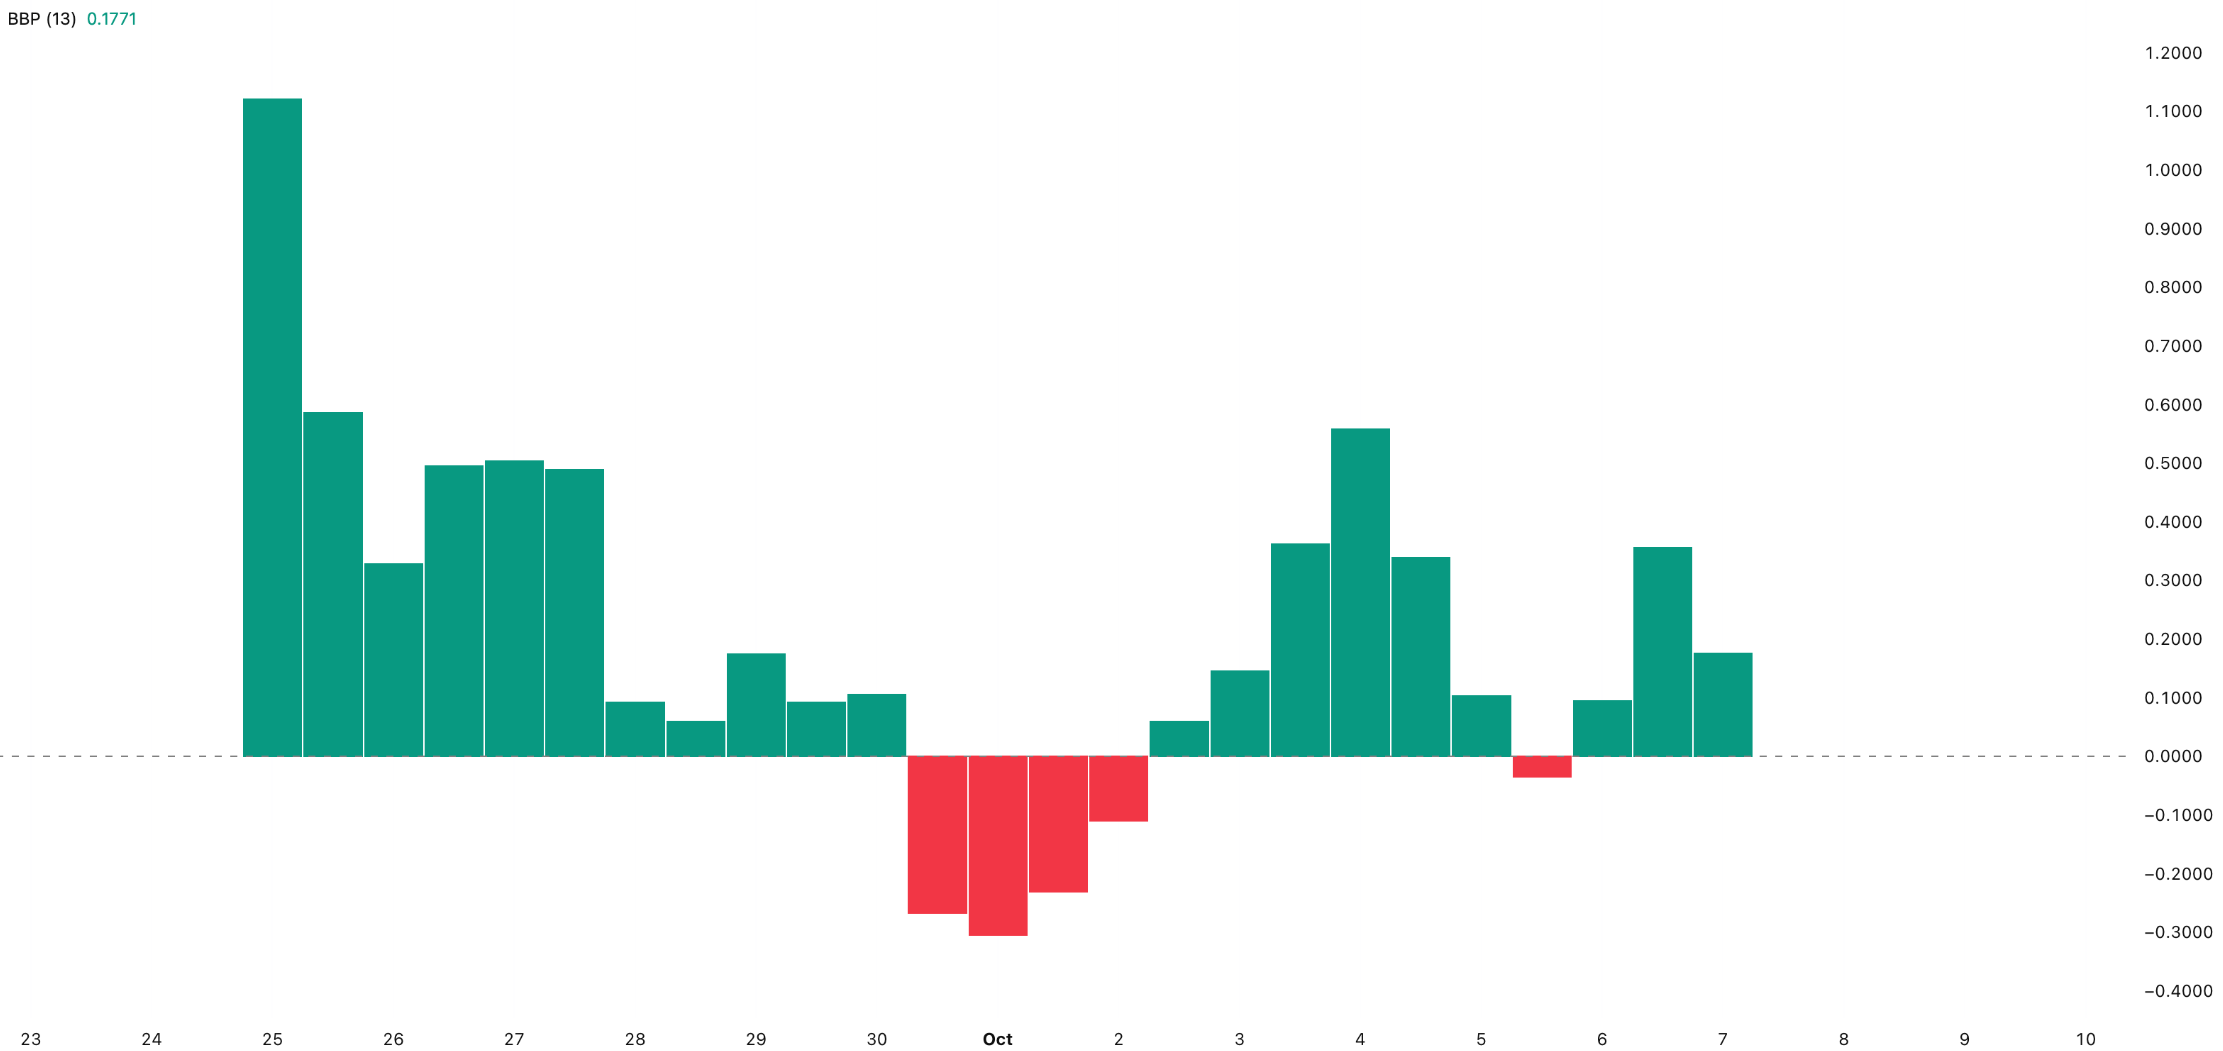
Chart Setup: Bulls Still Hold the Edge
Technically, ASTER is forming an ascending triangle pattern on the 12-hour chart—a structure that often favors buyers. The ascending trendline has been acting as firm support, and momentum indicators are showing constructive signs.
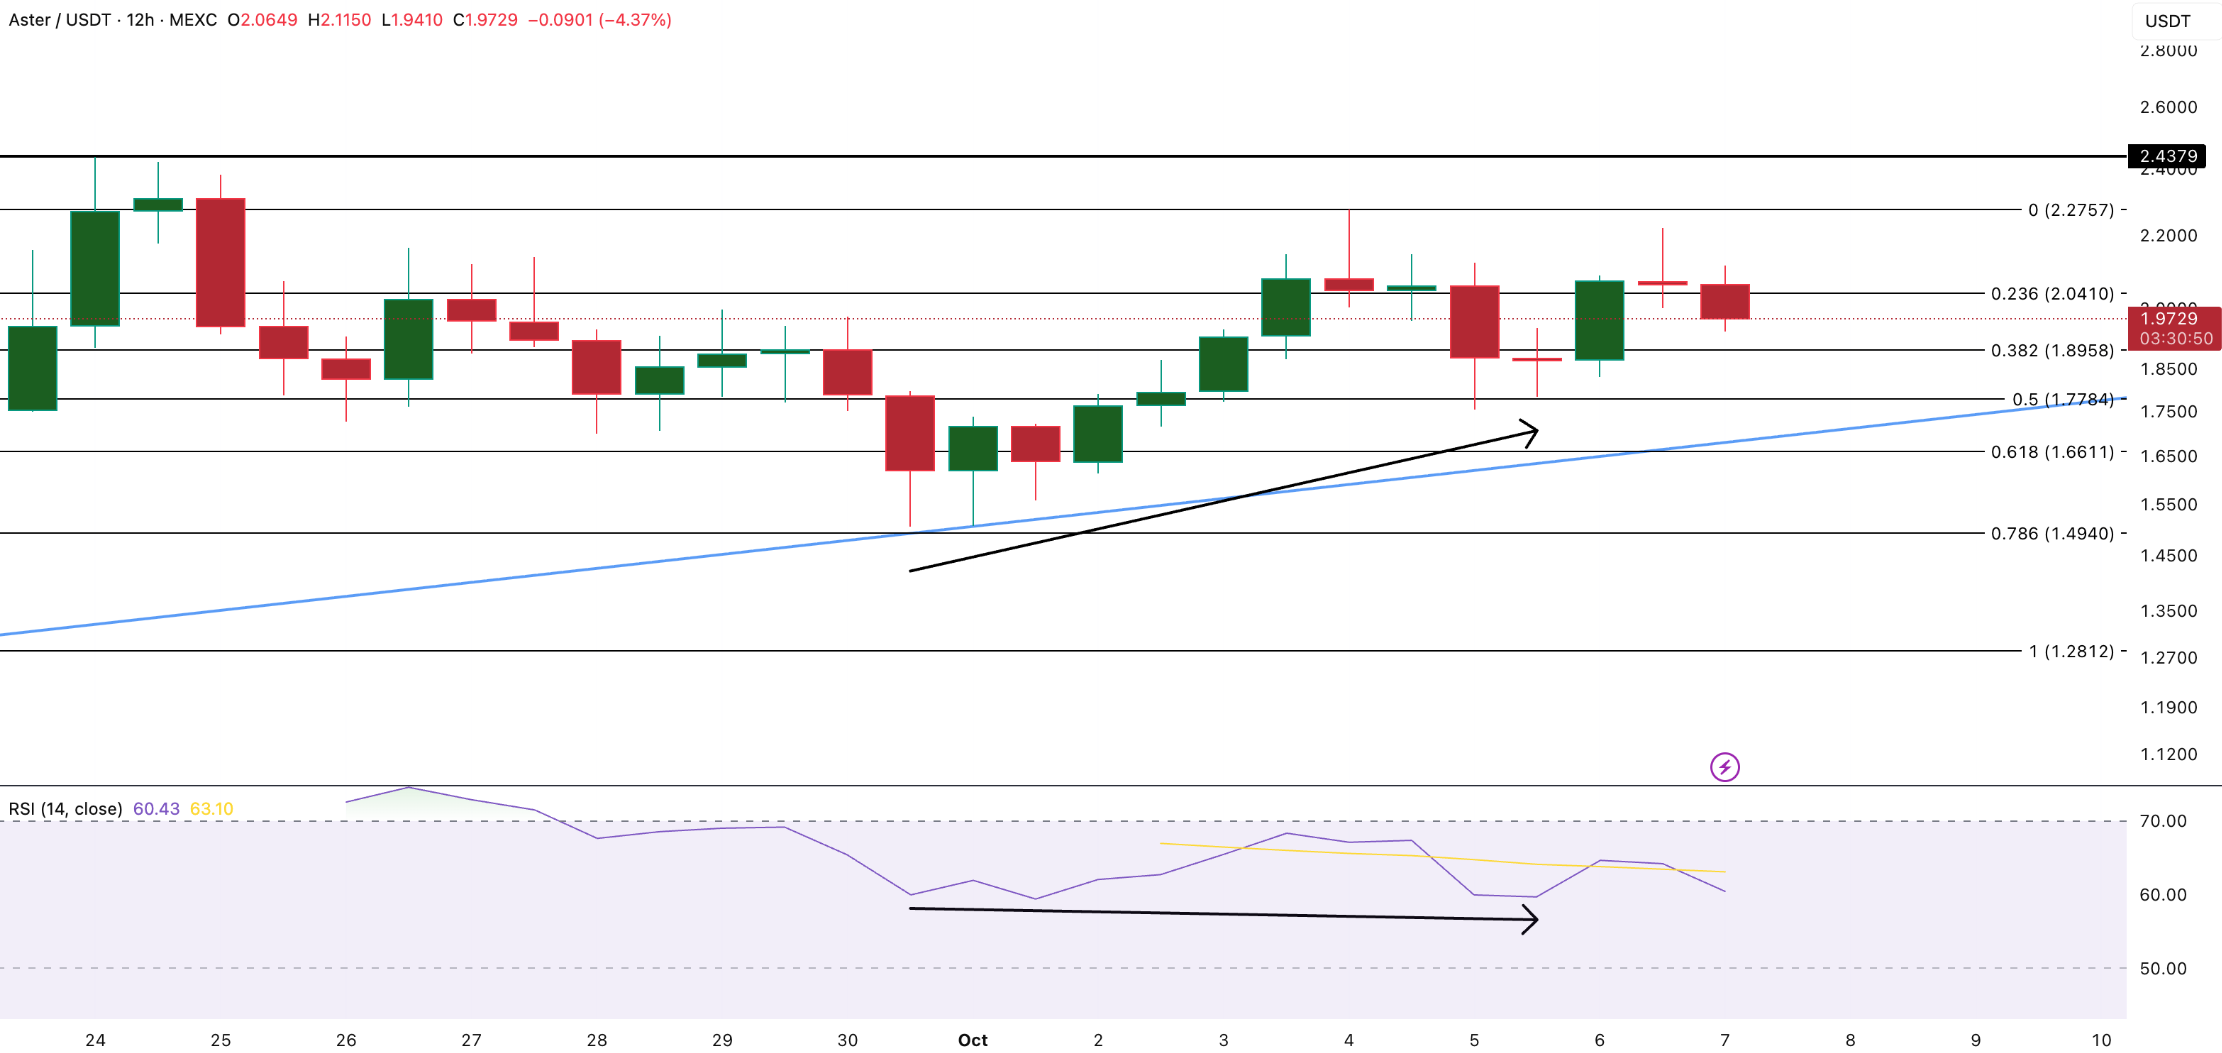
Between September 30 and October 5, the Relative Strength Index (RSI) created a hidden bullish divergence—prices made higher lows while RSI made lower lows. This pattern usually signals fading selling pressure and a potential continuation of the uptrend.
Key levels to watch:
- Resistance: $2.04, $2.27, and $2.43 (ATH)**
- Support: $1.77 and $1.66
A 12-hour close above $2.27 would likely confirm a breakout and open the door for a retest—and possibly a new high—above $2.43.
If ASTER dips below $1.77 and breaches the triangle support near $1.66, that would invalidate the bullish setup and shift short-term sentiment bearish.
Outlook: Whales Aren’t Leaving the Table
Despite short-term volatility, ASTER’s whale accumulation, rising MFI, and positive BBP suggest the bulls still have control. The token’s current structure favors a continued move higher—especially if it clears $2.27 with volume to back it up.
For now, one thing’s clear: the big holders aren’t cashing out, and neither should the market’s attention.


