
If you look at a raw cryptocurrency chart for the first time, it often looks like chaos. Green and red bars flash across the screen, moving up and down with no apparent rhyme or reason. But where a novice sees noise, an experienced trader sees patterns.
The primary tool used to find order in this chaos is the trendline.
While candlestick charts are excellent for showing price action, they don't tell you the bigger story on their own. Trendlines are the "connect the dots" of the trading world. They help you visualize the market's direction, identify where buyers and sellers are waiting, and, most importantly, signal when a trend is about to change.
The Basics: Connecting the Dots
At its core, a trendline is simply a straight line that connects two or more price points on a chart. It acts as a visual guide for the market sentiment.
- Uptrend (Bullish): You draw this line by connecting the higher lows. It slopes upwards, showing that demand is increasing and buyers are willing to pay higher prices over time.
- Downtrend (Bearish): You draw this line by connecting the lower highs. It slopes downwards, indicating that supply is exceeding demand and sellers are pushing the price lower.
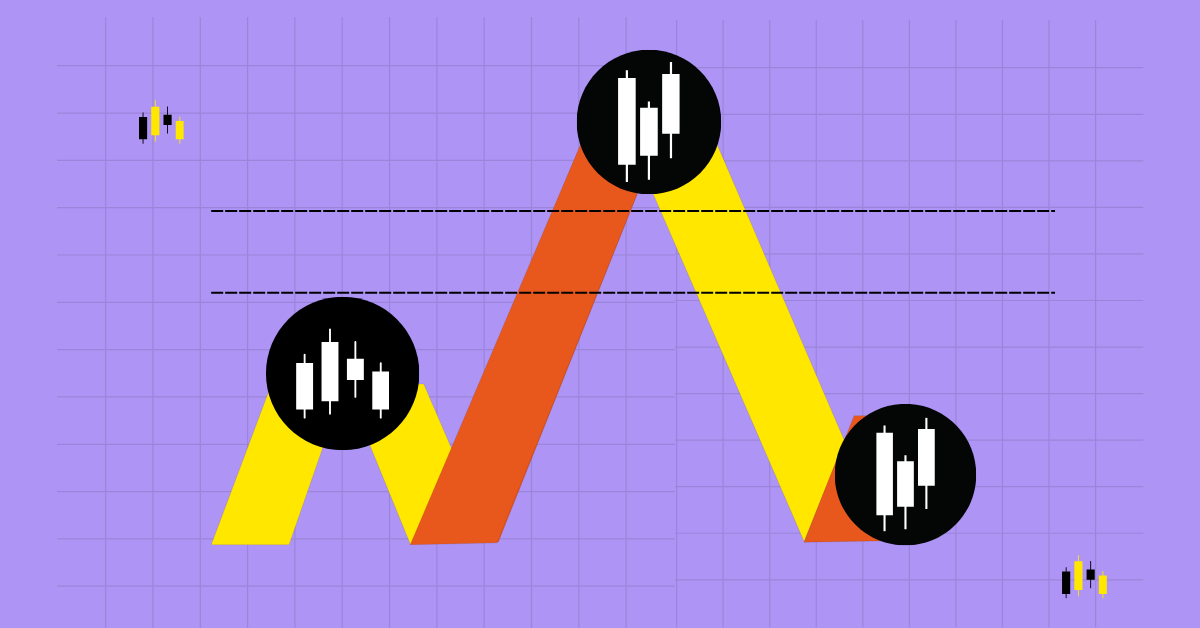
The Floor and The Ceiling: Support vs. Resistance
To truly master trendlines, you need to understand two concepts that govern almost all technical analysis: Support and Resistance.
Support (The Floor) Think of a support trendline as a floor that keeps the price from falling through. In an uptrend, you draw a line below the price action connecting the lowest points.
- What it means: When the price drops and touches this line, traders expect buyers to step in and push the price back up. It is a "safe zone" where demand is strong.
Resistance (The Ceiling) Conversely, resistance is like a glass ceiling the price struggles to break. In a downtrend, you draw this line above the price action connecting the peaks.
- What it means: When the price rallies and hits this line, traders expect sellers to take profit, pushing the price back down.
Channels: When the Market Finds a Rhythm
Sometimes, the market moves with beautiful symmetry. If you draw a support line connecting the lows and a parallel resistance line connecting the highs, you create a channel.
- Ascending Channel: Both lines are pointing up. The price bounces between them like a ball in a hallway.
- Descending Channel: Both lines are pointing down.
- Horizontal Channel (Ranging): The price is moving sideways. This is often called a trading range, where the market is undecided, neither bullish nor bearish.
Smart traders love channels because they offer clear instructions: buy at the bottom of the channel (support) and sell at the top (resistance).
The "Flip": When Roles Reverse
One of the most powerful signals in trading is the Support/Resistance Flip.
Trendlines are not brick walls; they eventually break. When the price finally smashes through a resistance line (the ceiling), that old ceiling often becomes the new floor (support). Buyers who missed the breakout wait for the price to come back down to test that line, using it as a launching pad for the next leg up.
How to Draw Trendlines Like a Pro
You do not need to be a math genius to draw these, but there are a few rules of thumb to keep your charts clean.
- Three is the Magic Number: You only need two points to draw a line, but a trend is not confirmed until the price touches the line a third time.
- Don't Force It: If the line cuts through the middle of the "bodies" of the candlesticks, it is probably invalid. A good trendline should touch the tips (wicks) or the edges of the candle bodies.
- Timeframes Matter: A trendline on a monthly chart carries much more weight than one on a 5-minute chart. The longer the timeframe, the stronger the trend.
Summary
Trendlines are the backbone of any solid trading strategy. They strip away the noise and reveal the true psychology of the market. Whether you are trading Bitcoin, stocks, or forex, learning to draw a simple line can be the difference between a lucky guess and a calculated trade.
Next Steps: Open a chart on TradingView or your favorite exchange. Try to find a clear uptrend and connect the lows. Watch how the price reacts the next time it touches that line.


