

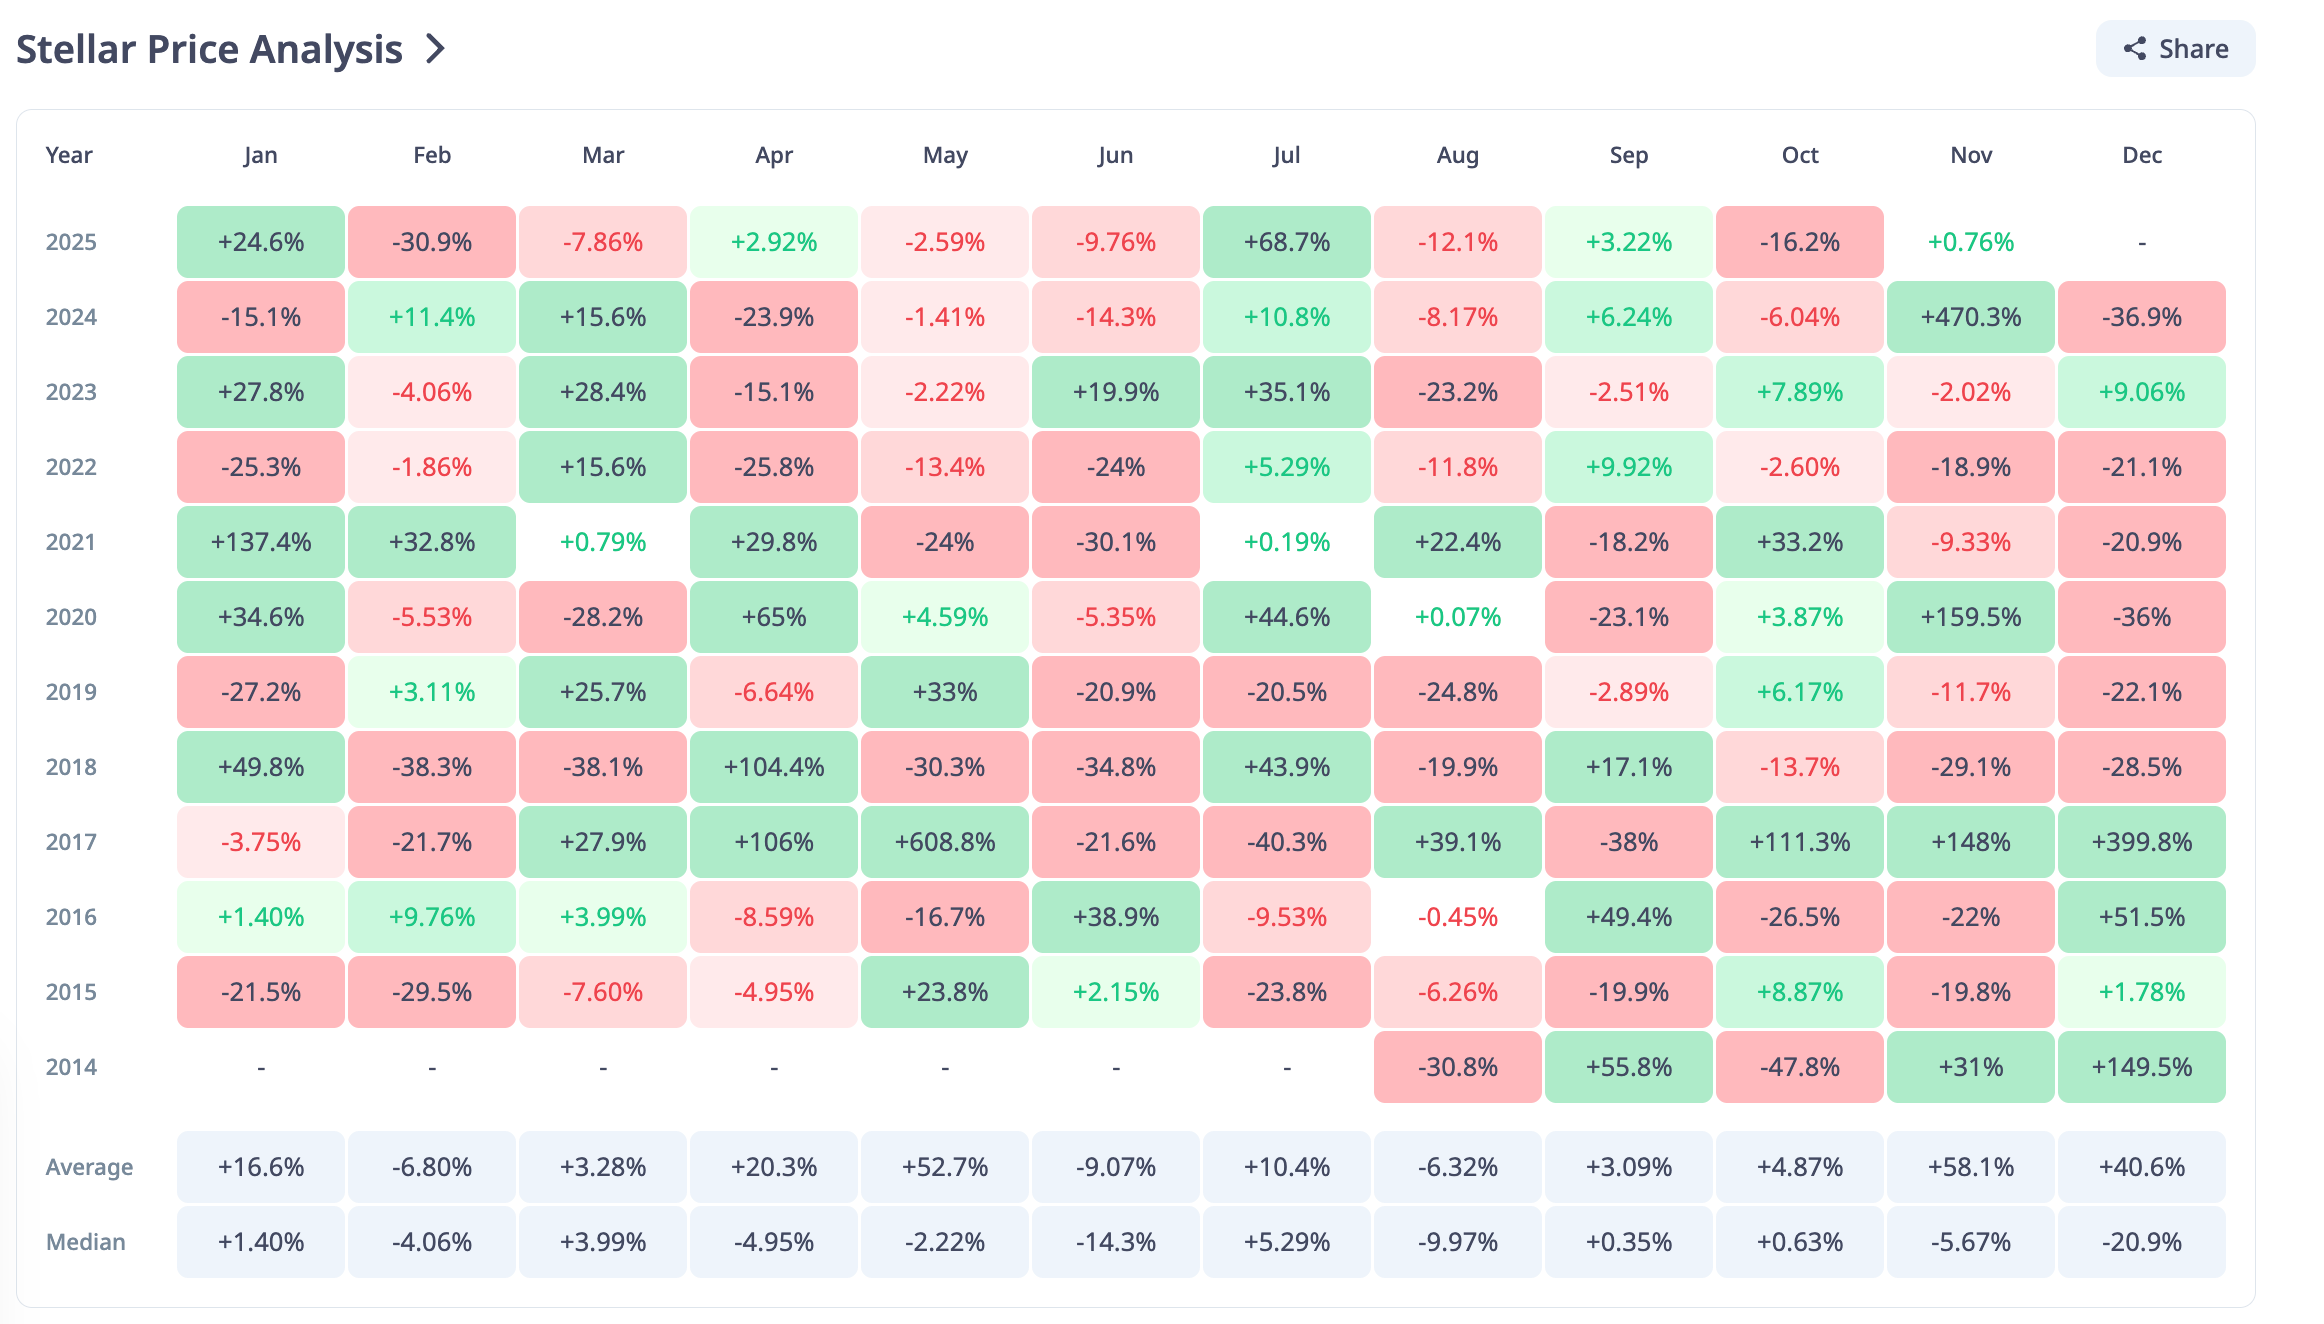
Stellar (XLM) has limped into November 2025 after a volatile October saw prices fall by roughly 17%. Currently trading flat near $0.30, the cryptocurrency faces a critical juncture. While historical data suggests November can be a strong month for XLM (average gain of +58% driven by massive historical rallies), the current technical setup shows a fragile, uncertain path forward.
Hidden Bearish Signal Threatens Short-Term Momentum
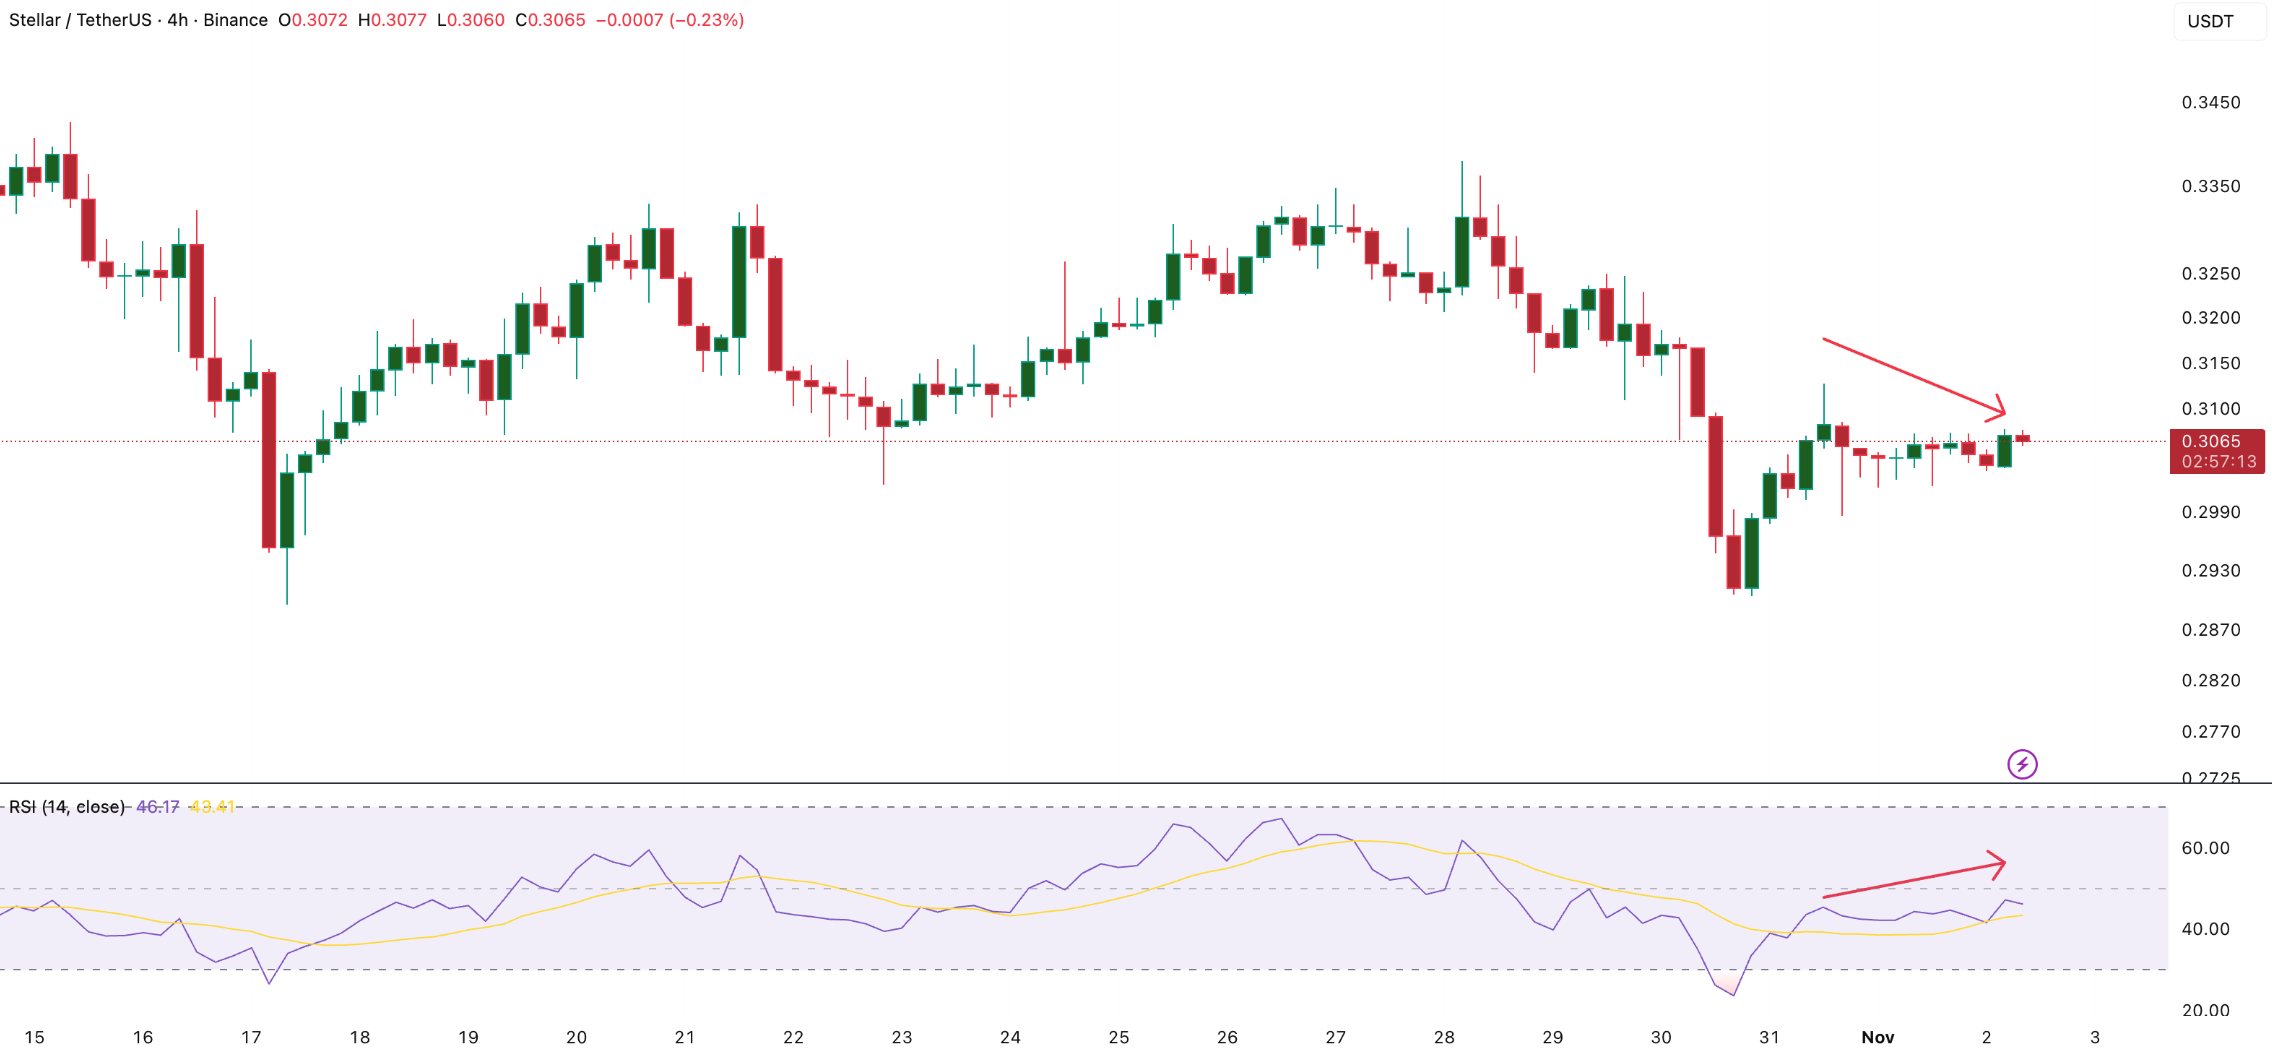
Despite the relatively stable price in early November, the short-term chart is flashing a warning sign that experienced traders can't ignore: a hidden bearish divergence.
- The Mismatch: While the XLM price has been forming lower highs (showing buyer hesitation), the Relative Strength Index (RSI)—a measure of buying and selling pressure—has simultaneously made higher highs.
- The Implication: This technical mismatch suggests that buyers are losing energy even as the price appears steady. This fragile momentum hints at a potential downside correction in the coming days, meaning the weakness from October could still dominate.
Money Flow: Short-Term Hope, Institutional Caution
Looking at the flow of capital provides mixed signals that reflect the overall uncertainty:
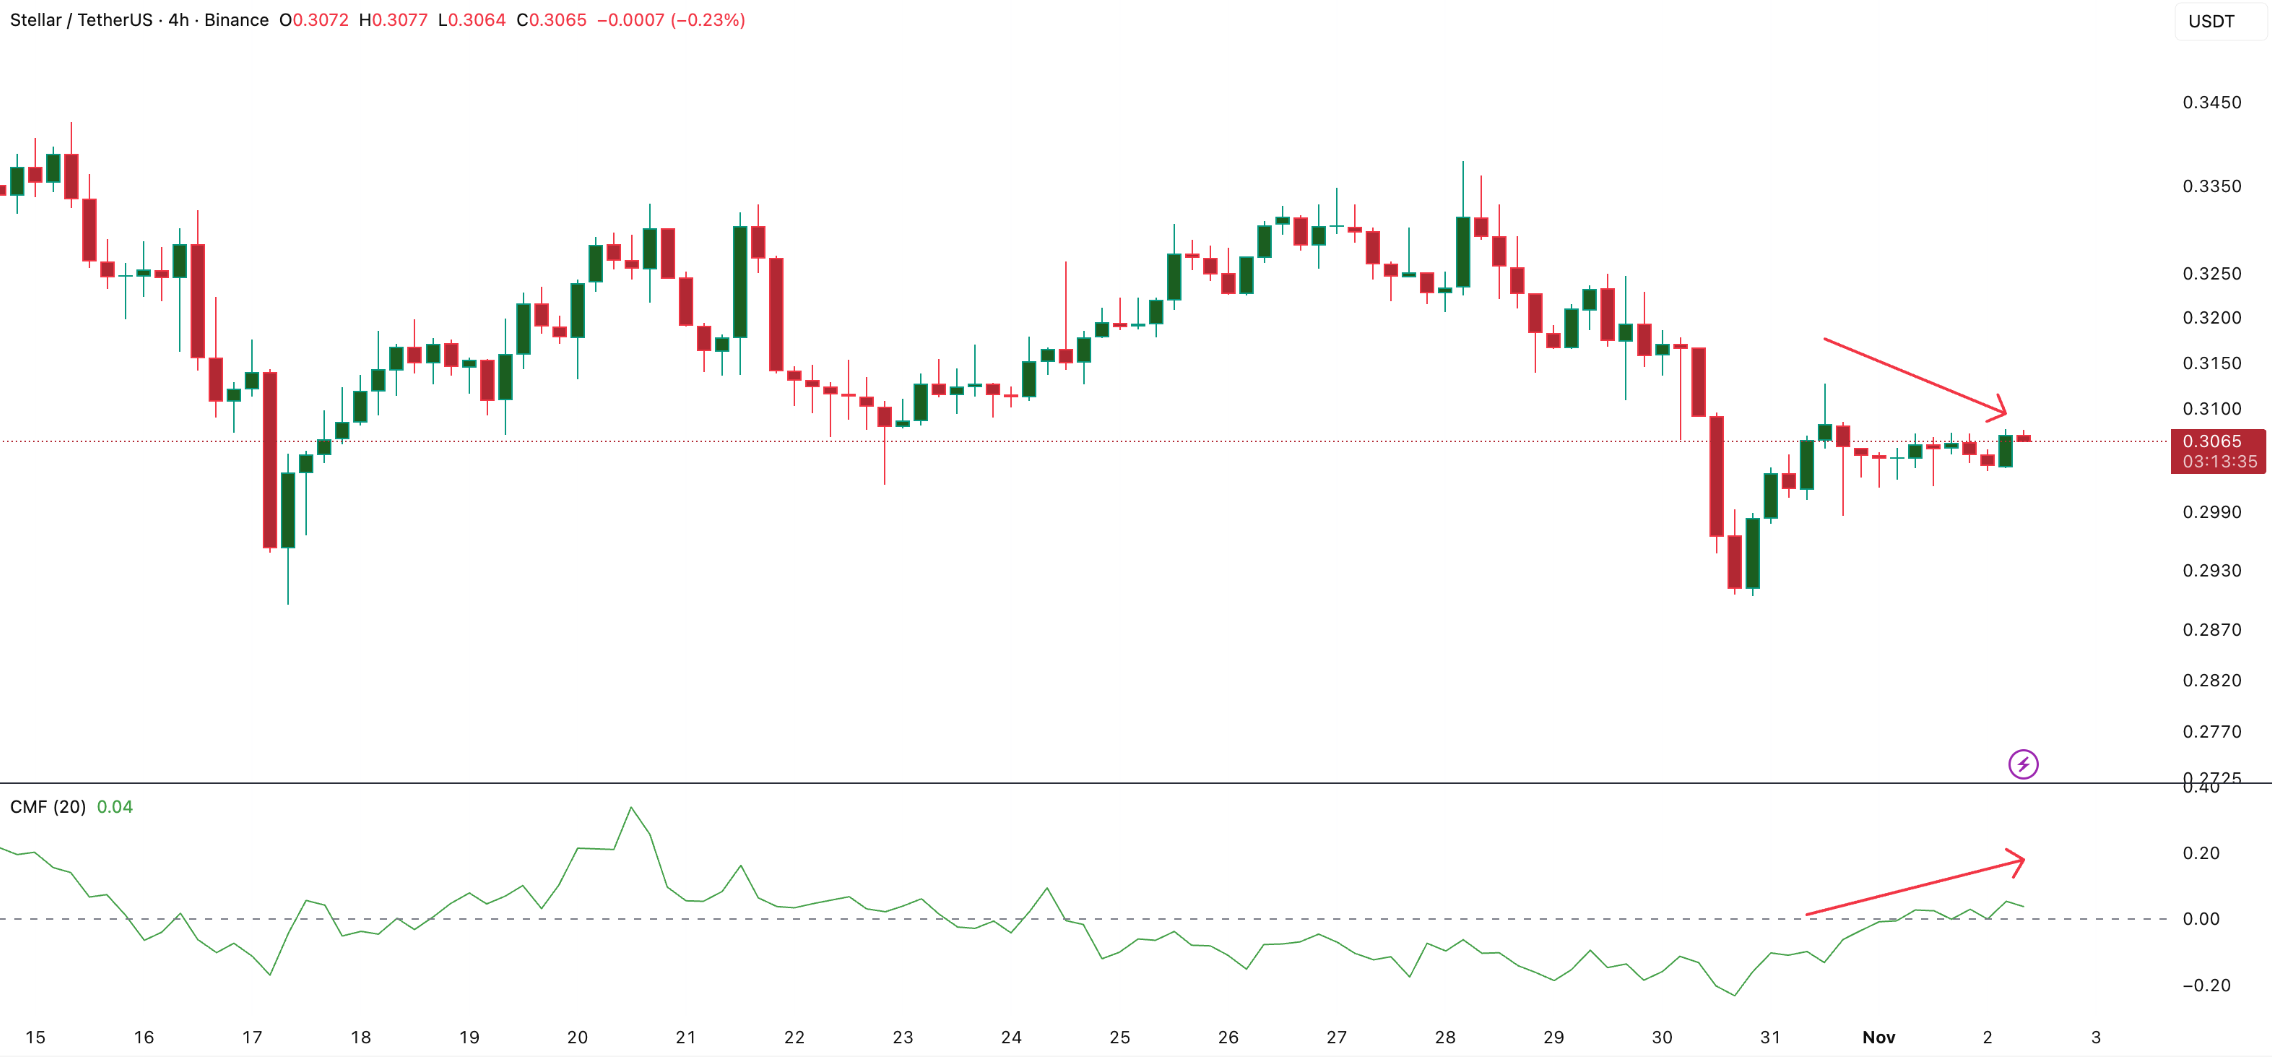
- Short-Term Inflow: The Chaikin Money Flow (CMF) indicator is showing a slightly positive reading (around +0.04) on shorter time frames. A positive CMF means money is starting to flow into XLM, indicating that short-term buyers might be attempting a small rebound.
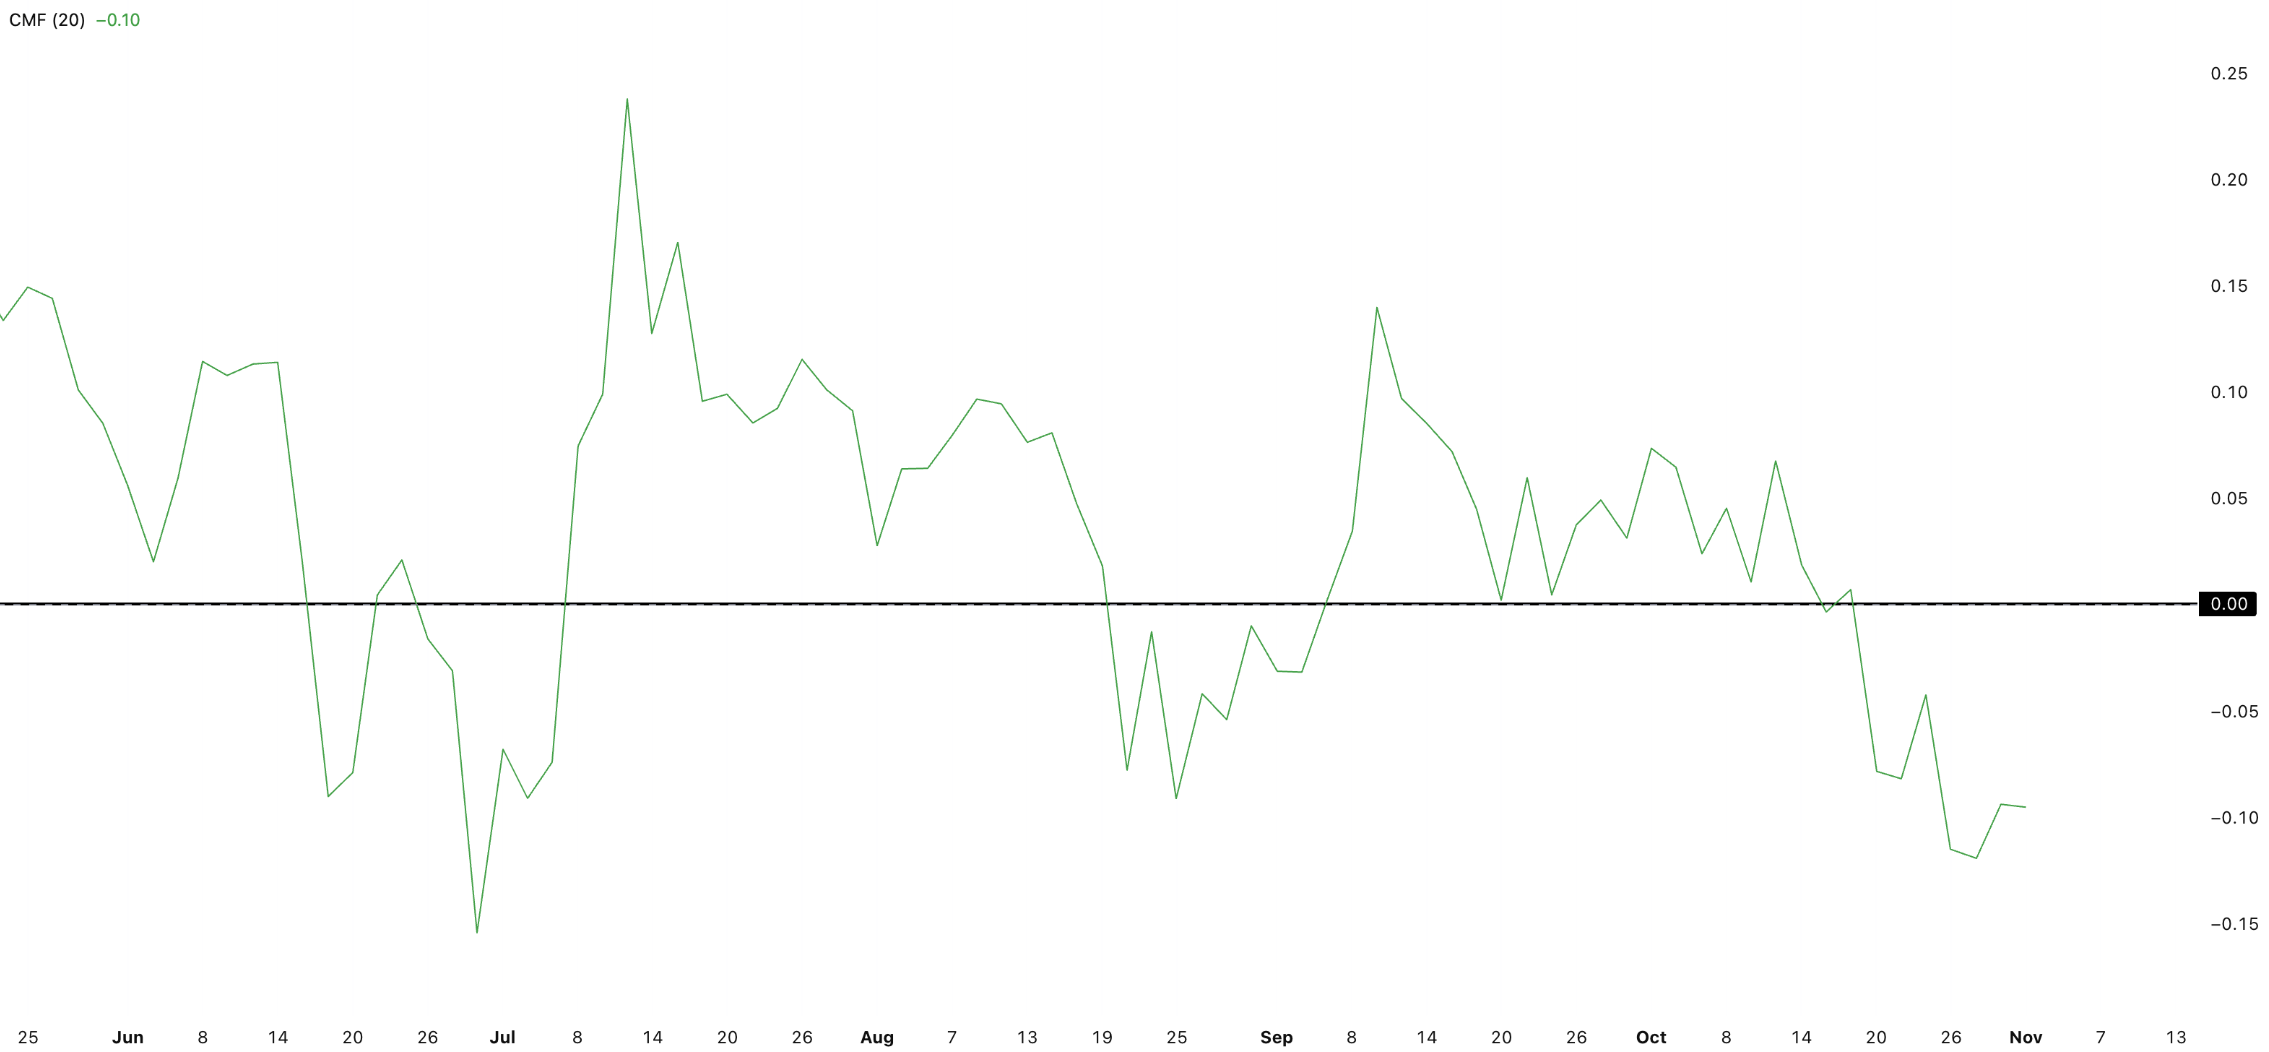
- Long-Term Caution: However, when zooming out to the two-day chart, the CMF remains firmly negative (near -0.10). This suggests that large holders and institutional money haven't returned in force. Until this larger CMF flips positive, any recovery is likely to be brief and unsupported.
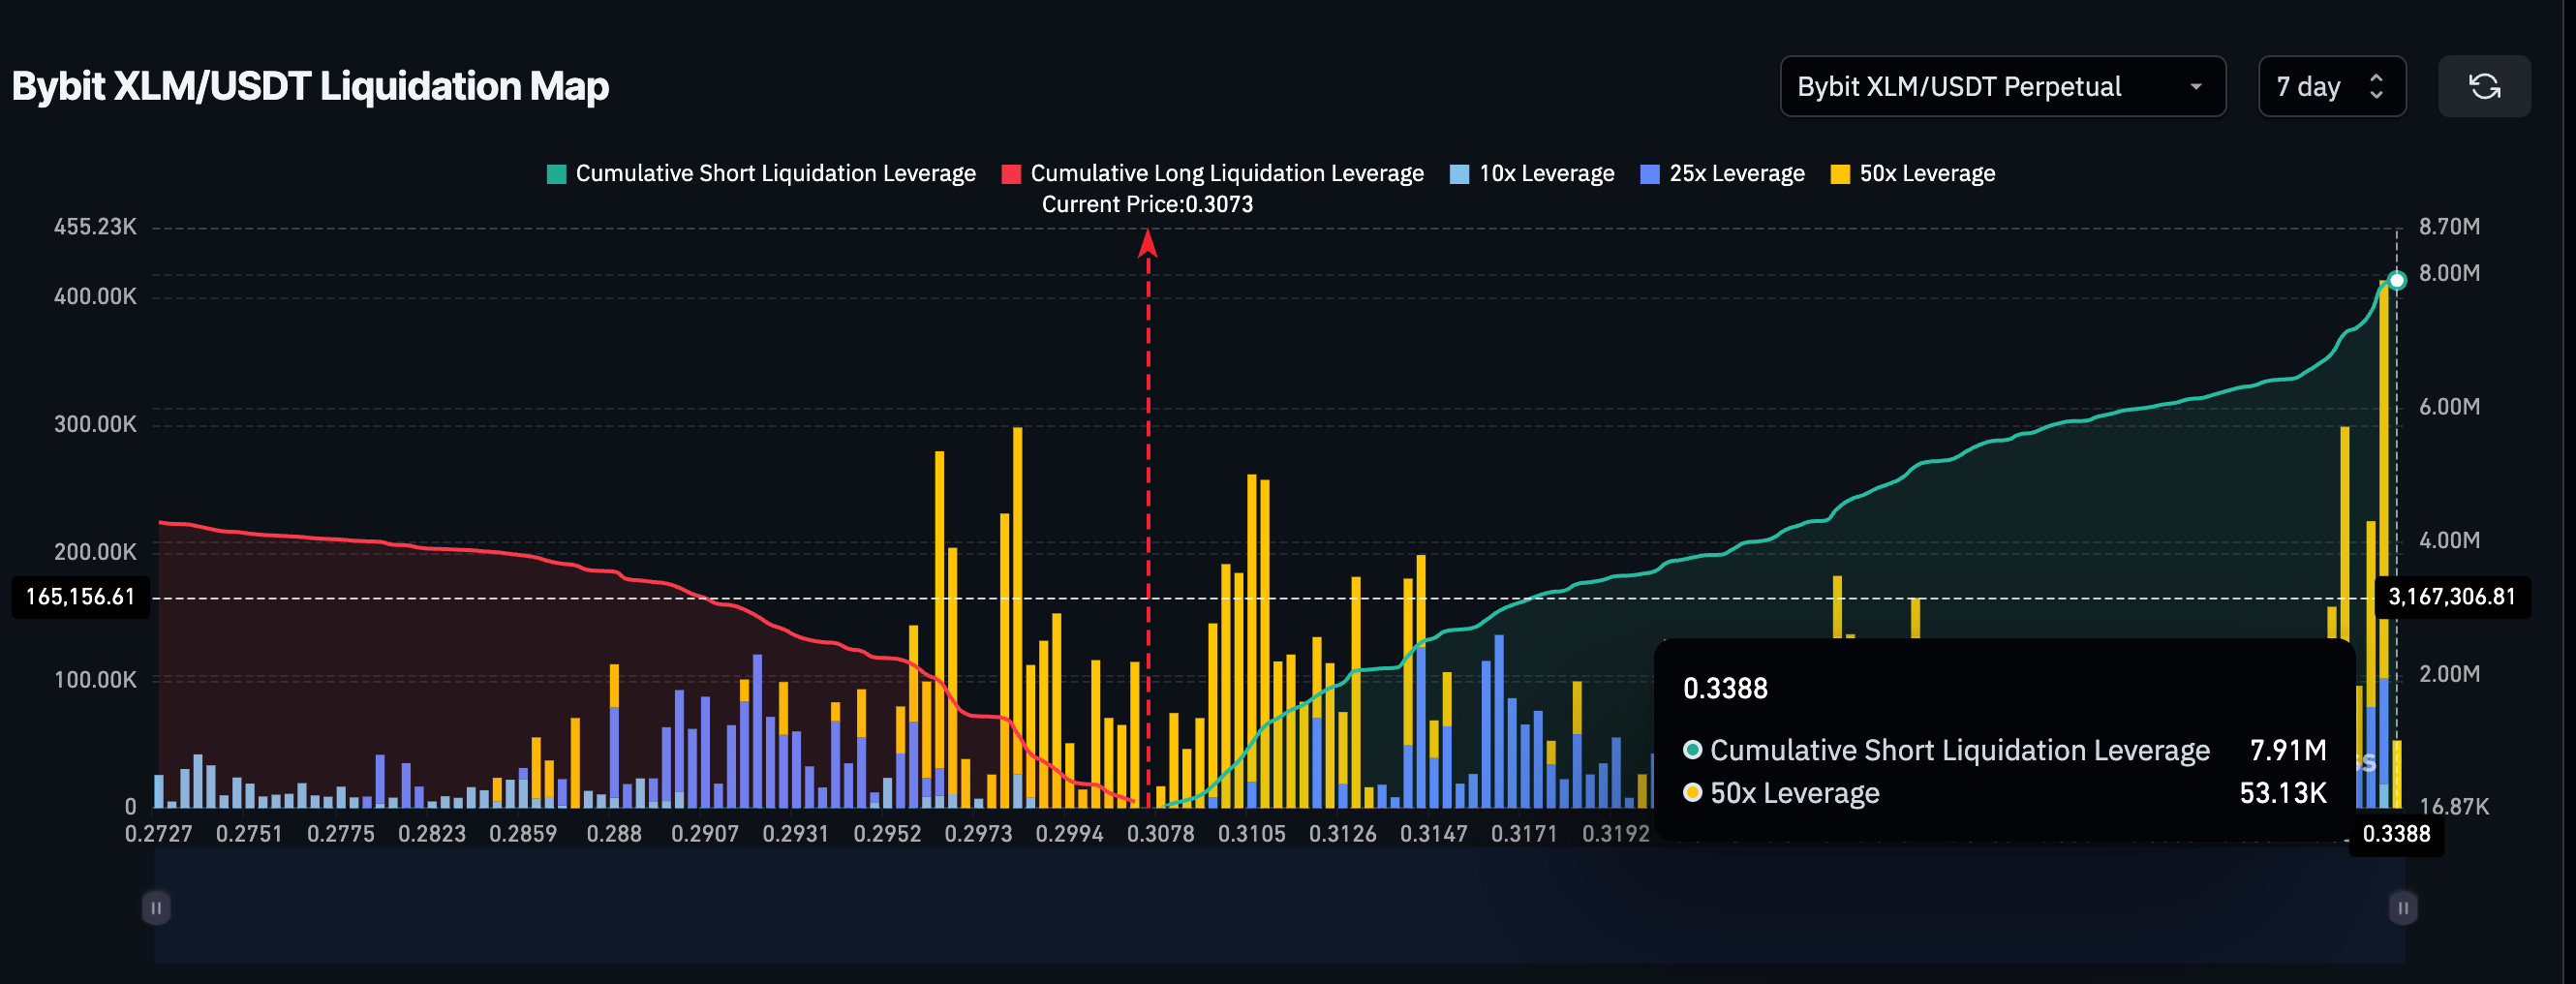
The Short Squeeze Setup
Derivatives data adds another layer of tension. Exchange figures show a significant imbalance, with nearly $7.9 million in short positions compared to only $4.3 million in long positions. This gap sets up the potential for a short squeeze: if the price manages to climb slightly, short sellers could be forced to buy back quickly, creating a temporary, sharp upward bounce. For now, however, that move remains dependent on fleeting short-term inflows.
The Crucial Battle Zone: $0.27 to $0.37
The XLM price is currently coiling inside a symmetrical triangle on the two-day chart, a pattern that signals indecision until one side takes control. The market's direction for the rest of November hinges entirely on which side of this tight range breaks first.
| Scenario | Key Levels | Implication |
| Bearish Breakout | A close below $0.27 (the lower trendline). | Confirms October's weakness, opening the path to retest $0.21 and possibly $0.19. |
| Bullish Breakout | A close above $0.35 and sustained movement past $0.37. | Could signal a move to retest the upper range, with a target of $0.47 and potential extension to $0.52. |
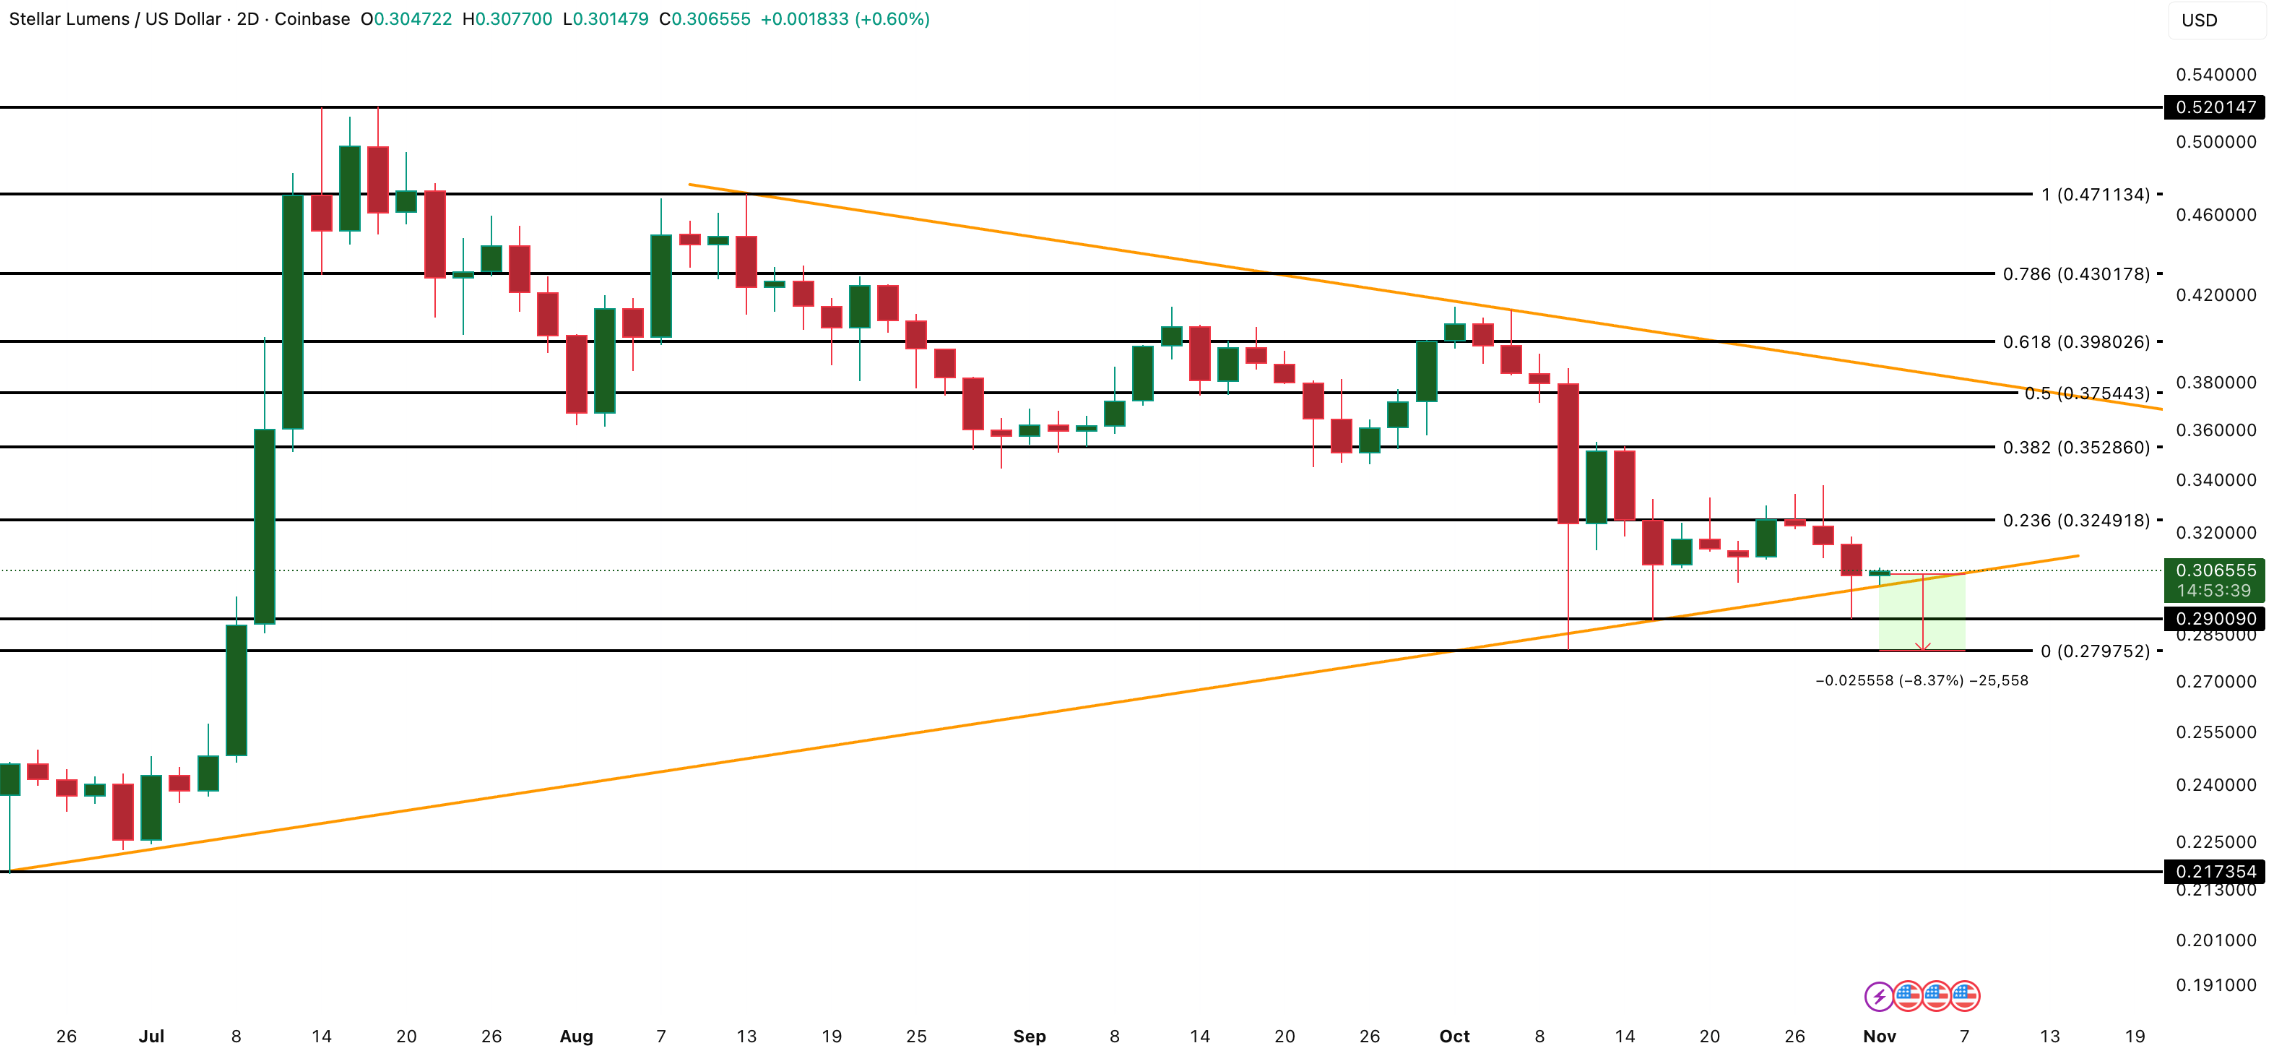
Given the weak momentum shown by the RSI's hidden bearish divergence, the risk remains tilted toward testing the lower trendline at $0.27 first. Traders will be watching these levels closely to confirm Stellar's near-term direction.


