
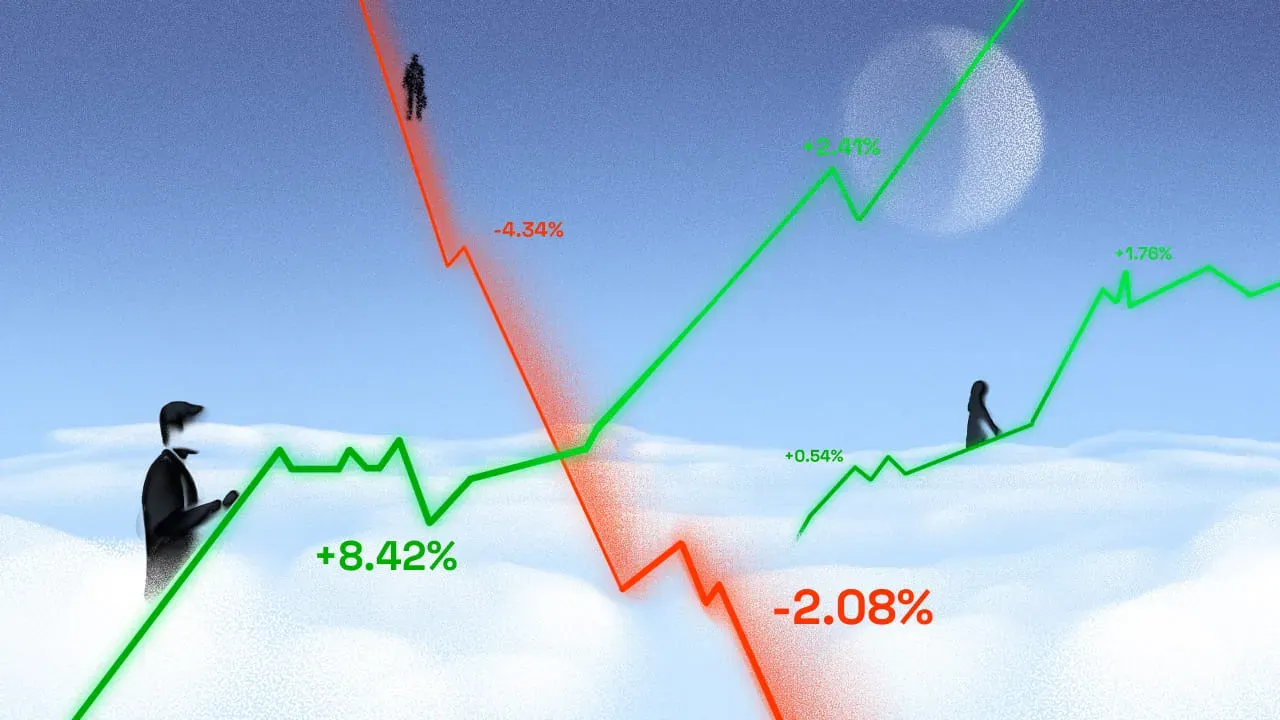
If you’ve ever watched a marathon, you’ll notice that even the best runners occasionally slow down to grab a cup of water before sprinting toward the finish line. In the financial markets, price trends do the exact same thing.
When an asset is in a strong uptrend or downtrend, it rarely moves in a straight line. Instead, it takes "breathers" - short periods of sideways or choppy movement called consolidation. Continuation chart patterns are the footprints left during these breaks. For a trader, spotting these patterns is like seeing a runner grab that water cup: it’s a signal that the original trend isn't over yet; it’s just getting ready for the next leg.
The Anatomy of a Continuation
The magic of these patterns lies in their predictability. While reversal patterns tell you the party is over, continuation patterns suggest the market is just refilling the punch bowl.
Here are the heavy hitters you’ll see on the charts of everything from Bitcoin to Apple stock.
Flags and Pennants: The Sprint Signals
These are the most common short-term patterns. They happen after a "flagpole" - a sharp, nearly vertical price move on high volume.
- Bull and Bear Flags: After the flagpole, the price settles into a small, narrow rectangle that slopes slightly against the trend. A bull flag slopes down; a bear flag slopes up. When the price breaks out of this "flag," it usually covers a distance similar to the original flagpole.
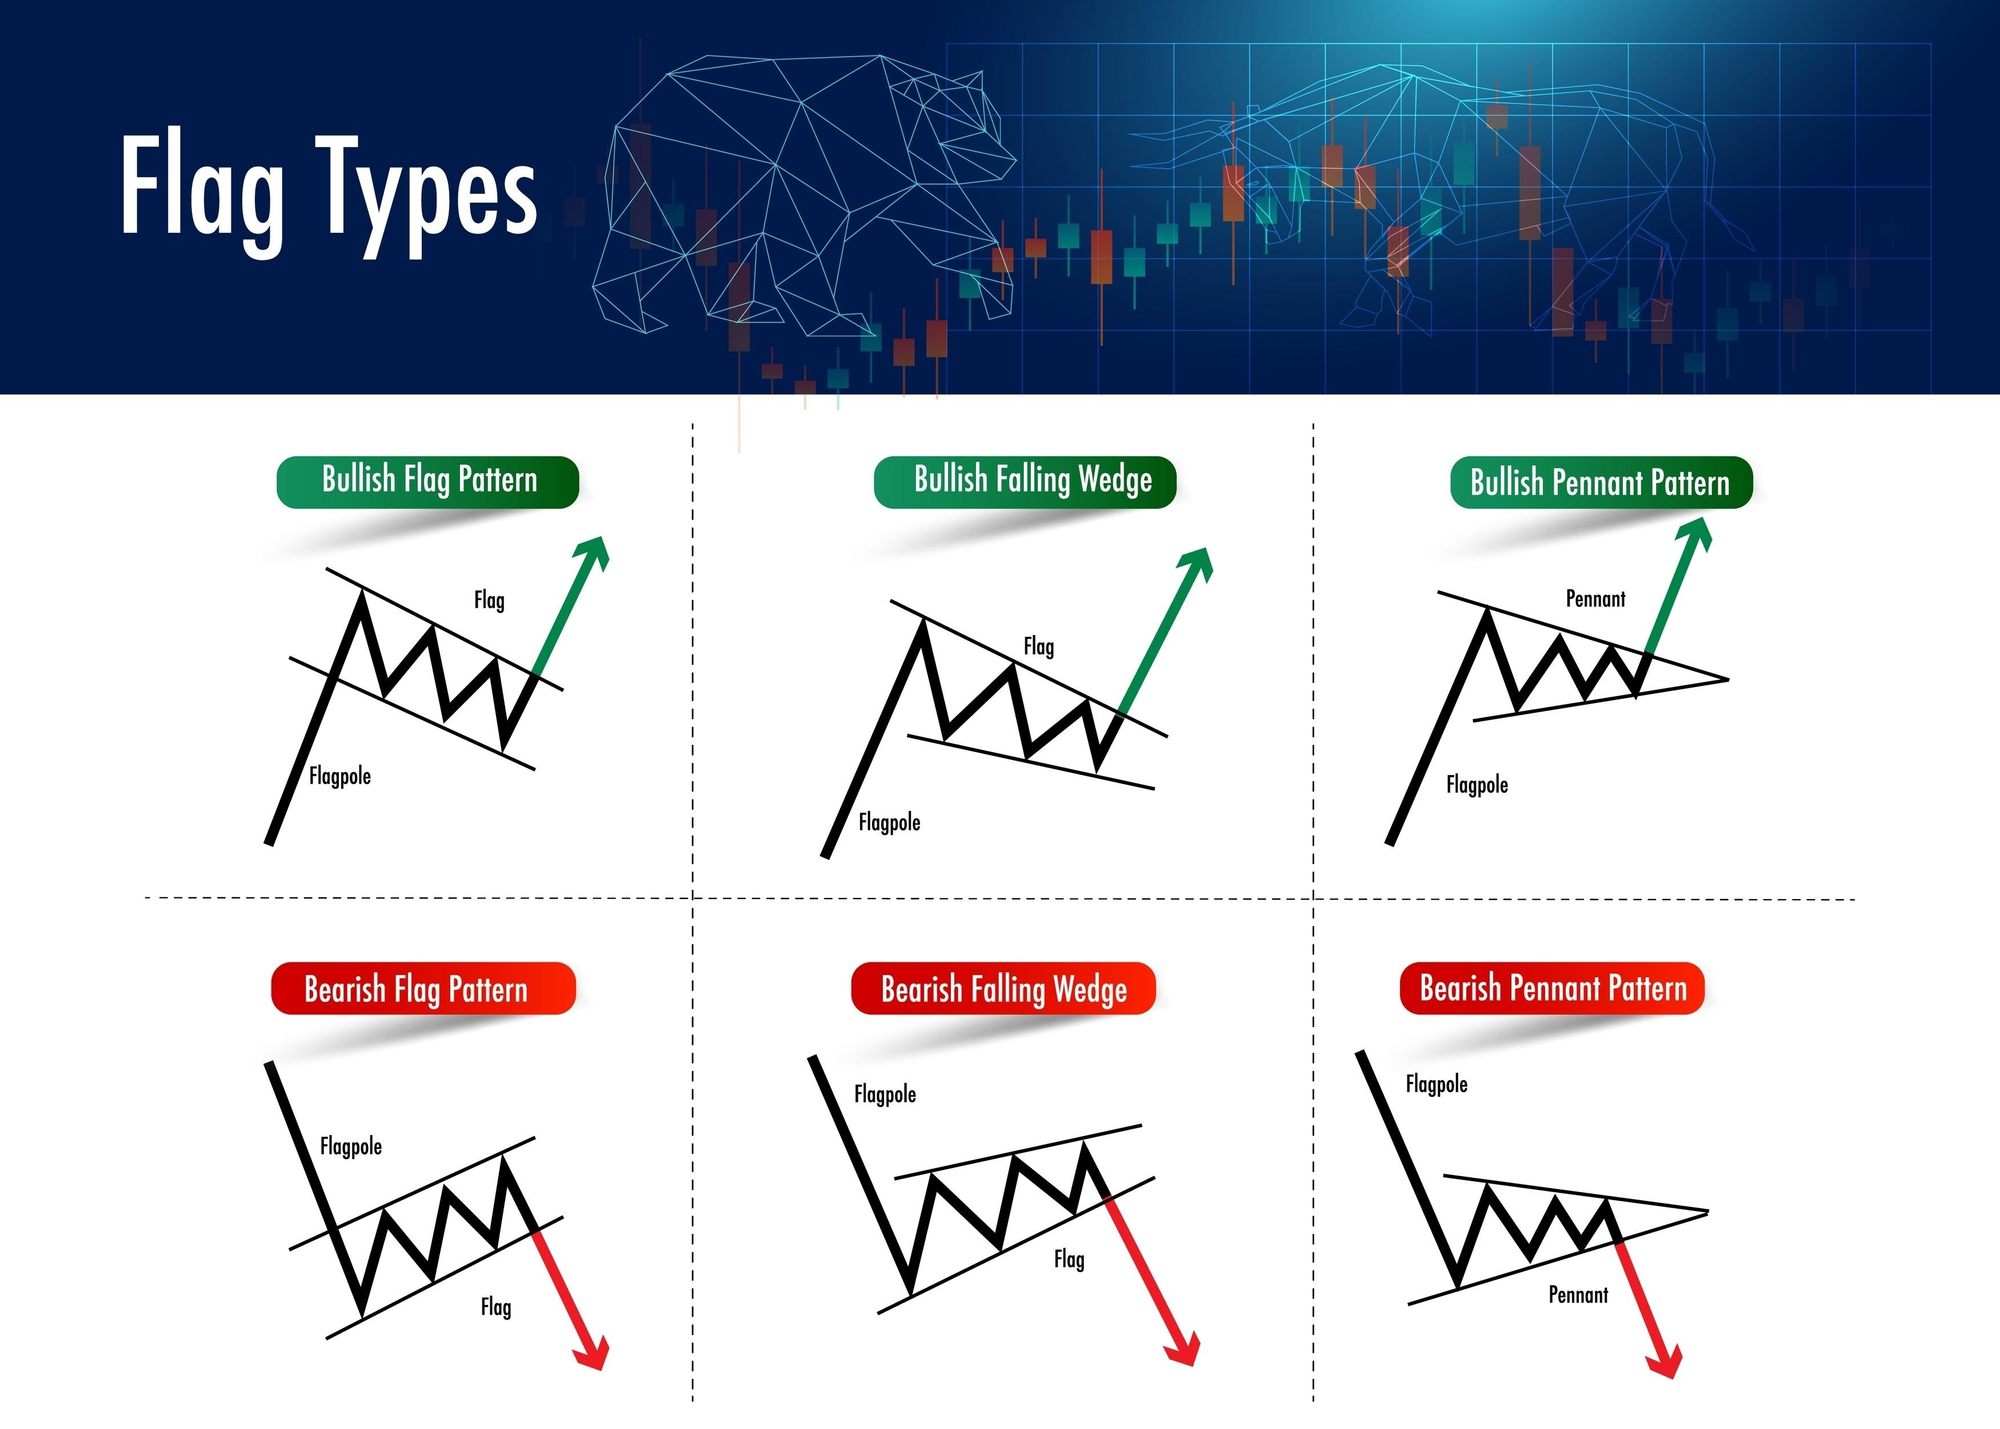
- Bull and Bear Pennants: These look almost identical to flags, but instead of a rectangle, the consolidation looks like a tiny symmetrical triangle. The price gets squeezed into a tight point before exploding back in the direction of the original trend.
The Cup and Handle: The Patient Professional
This is a classic bullish setup that develops over a longer period. It looks exactly like its name:
- The Cup: A "U" shaped recovery where the price drops, rounds out at the bottom, and climbs back up to its previous high.
- The Handle: A small, downward-sloping drift (much like a bull flag) right at the edge of the cup.
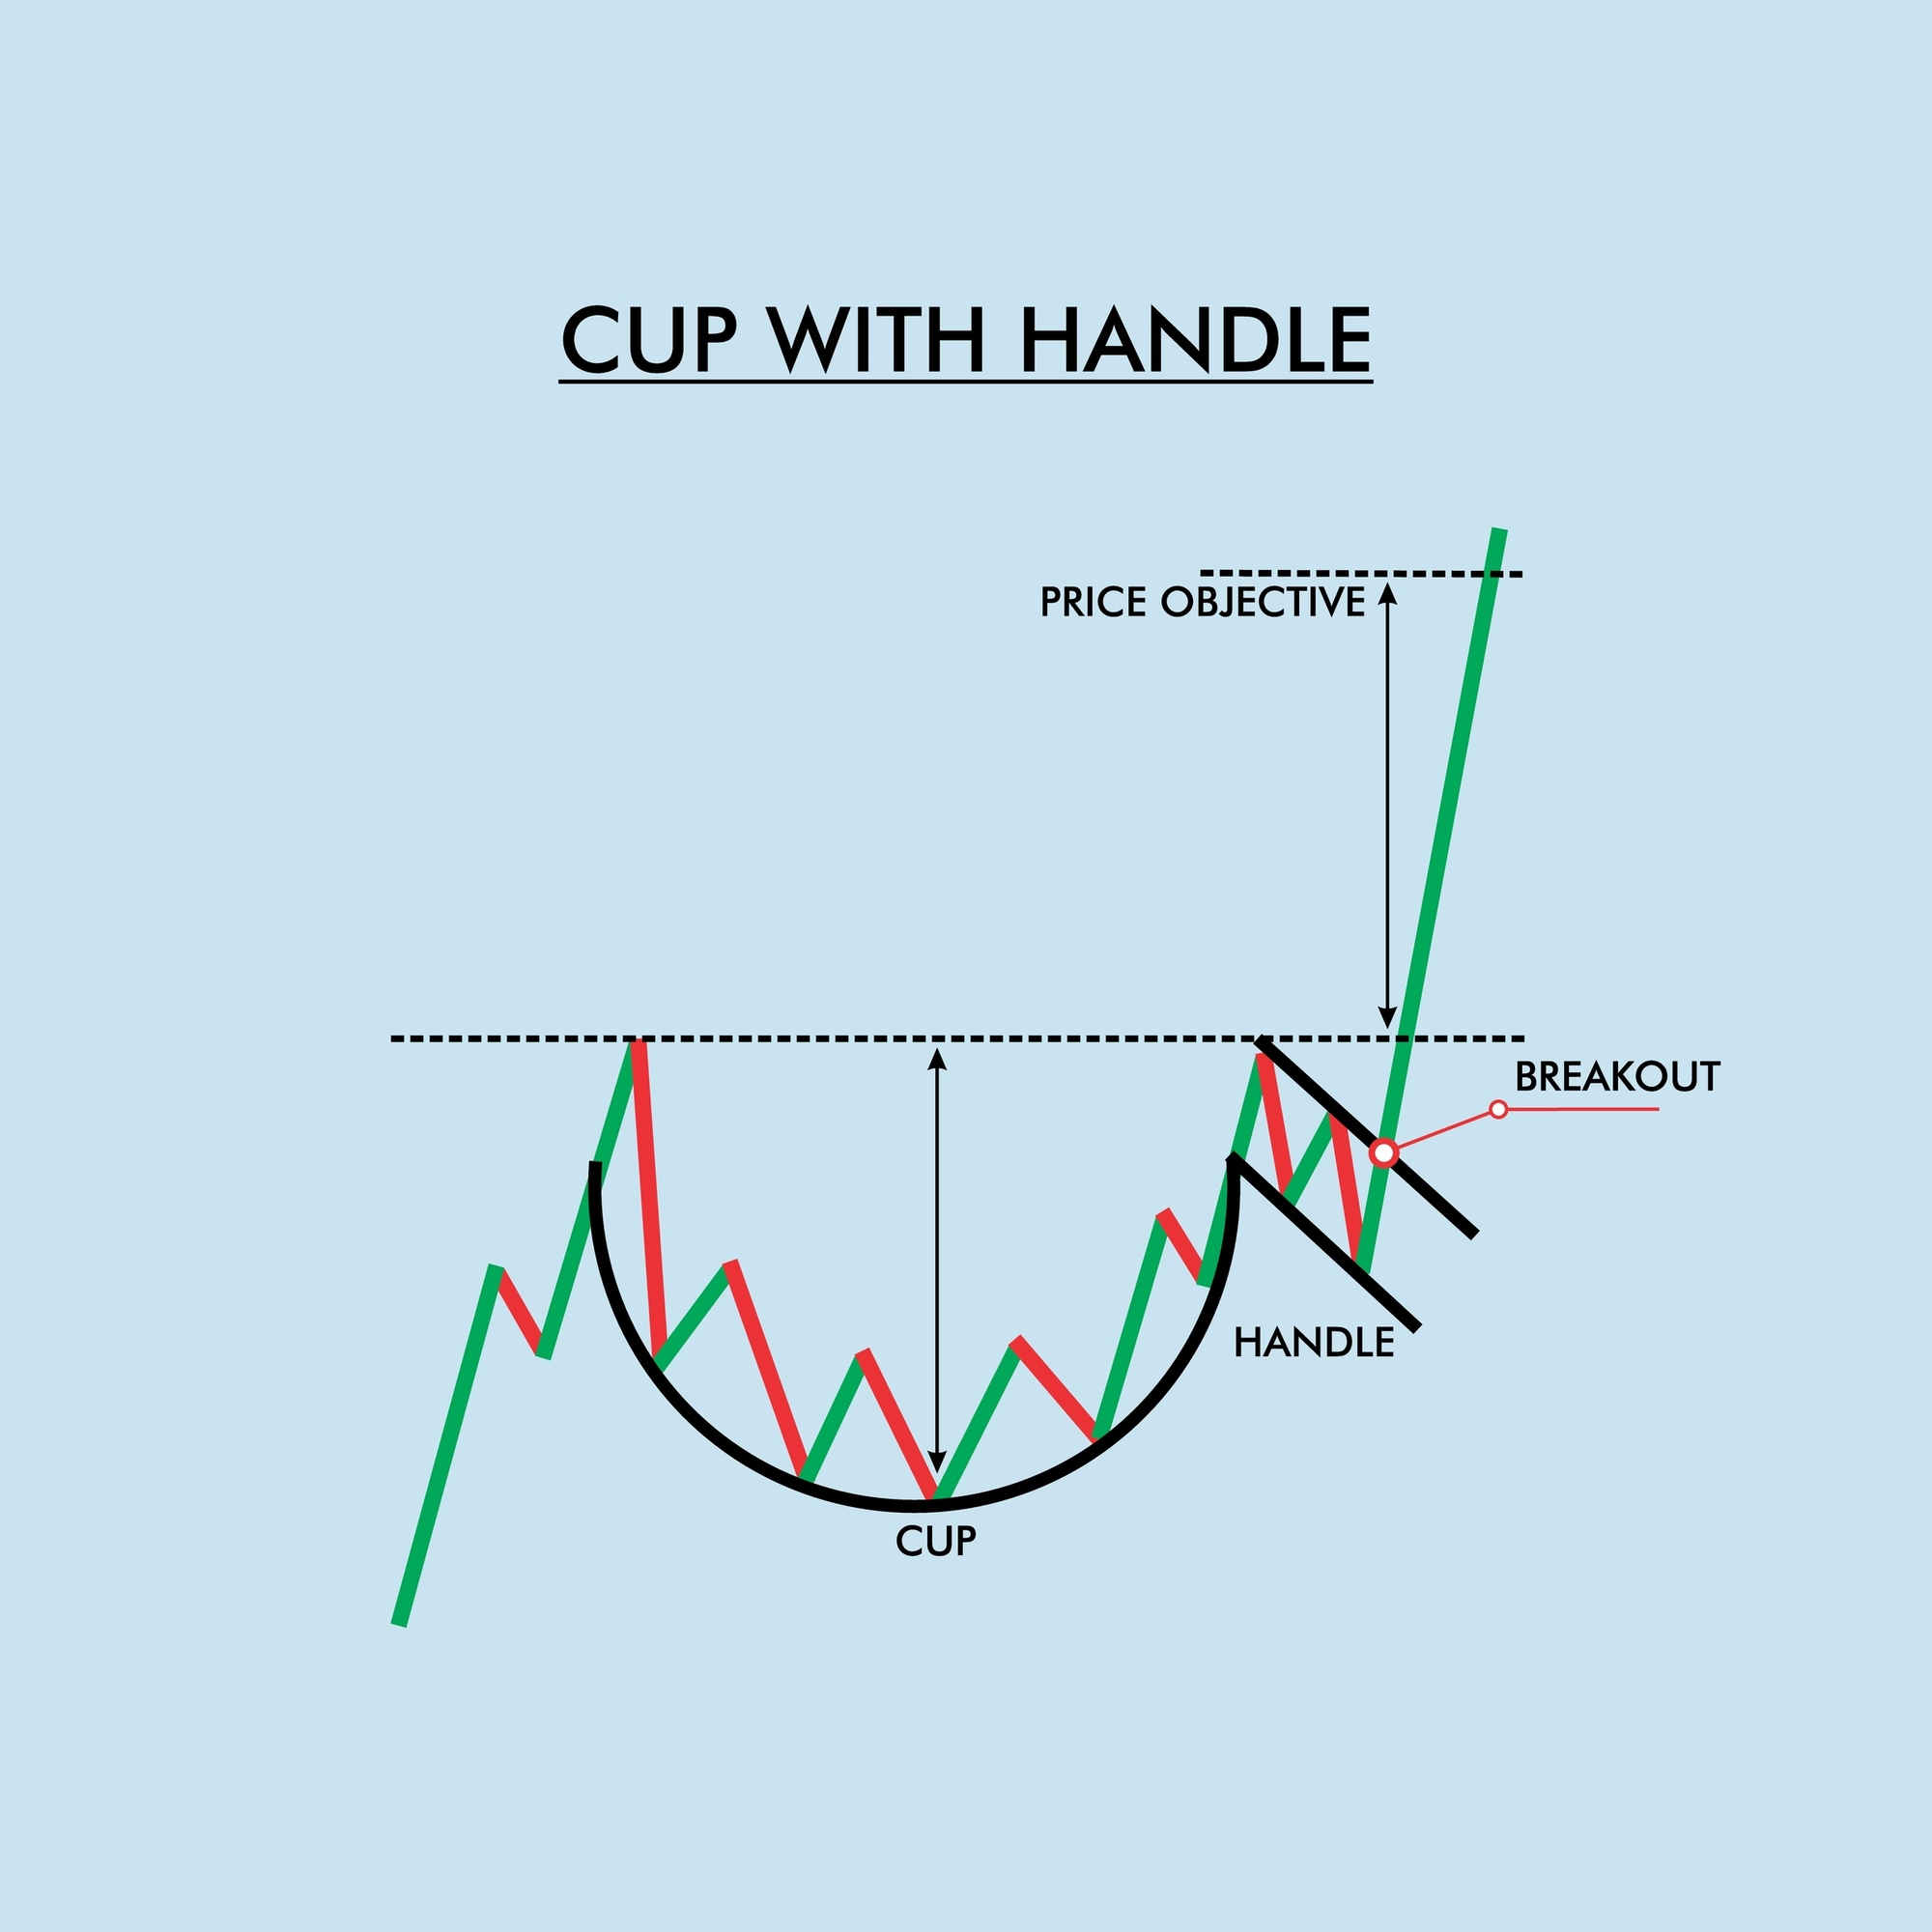
When the price breaks above the handle, it’s often a sign of massive bullish conviction. There is also an Inverted Cup and Handle, which is the "evil twin" of this pattern, signaling that a downtrend is about to resume after a failed attempt at a recovery.
Wedges: The Pressure Cookers
Wedges are unique because they can be a bit of a "head fake." They consist of two converging trendlines, but both are pointing in the same direction.
- Falling Wedge (Bullish): The price is making lower highs and lower lows, but the range is getting tighter and tighter. Even though the price is falling, the "selling pressure" is actually running out. Once it breaks the upper line, expect a surge.
- Rising Wedge (Bearish): The opposite happens. The price climbs with higher highs and higher lows, but the "buying power" is thinning out. When the bottom line breaks, a sharp sell-off often follows.
A Word of Caution: Don’t Trade in a Vacuum
Patterns are powerful, but they aren't crystal balls. A "perfect" bull flag can fail if there’s a sudden piece of bad news or if the overall market sentiment shifts. To trade these effectively, savvy investors look for confirmation:
- Volume: Ideally, volume should drop during the "breather" and spike during the "breakout."
- The Trend: Only look for continuation patterns if there is a clear, strong trend already in place. Trying to find a bull flag in a flat, sideways market is a recipe for a "fakeout."
Summary
- Continuation patterns signal that a trend is pausing, not ending.
- Flags and Pennants are quick, high-momentum moves.
- Cup and Handles are long-term setups for patient traders.
- Wedges show momentum is "choking" and a breakout is imminent.


