

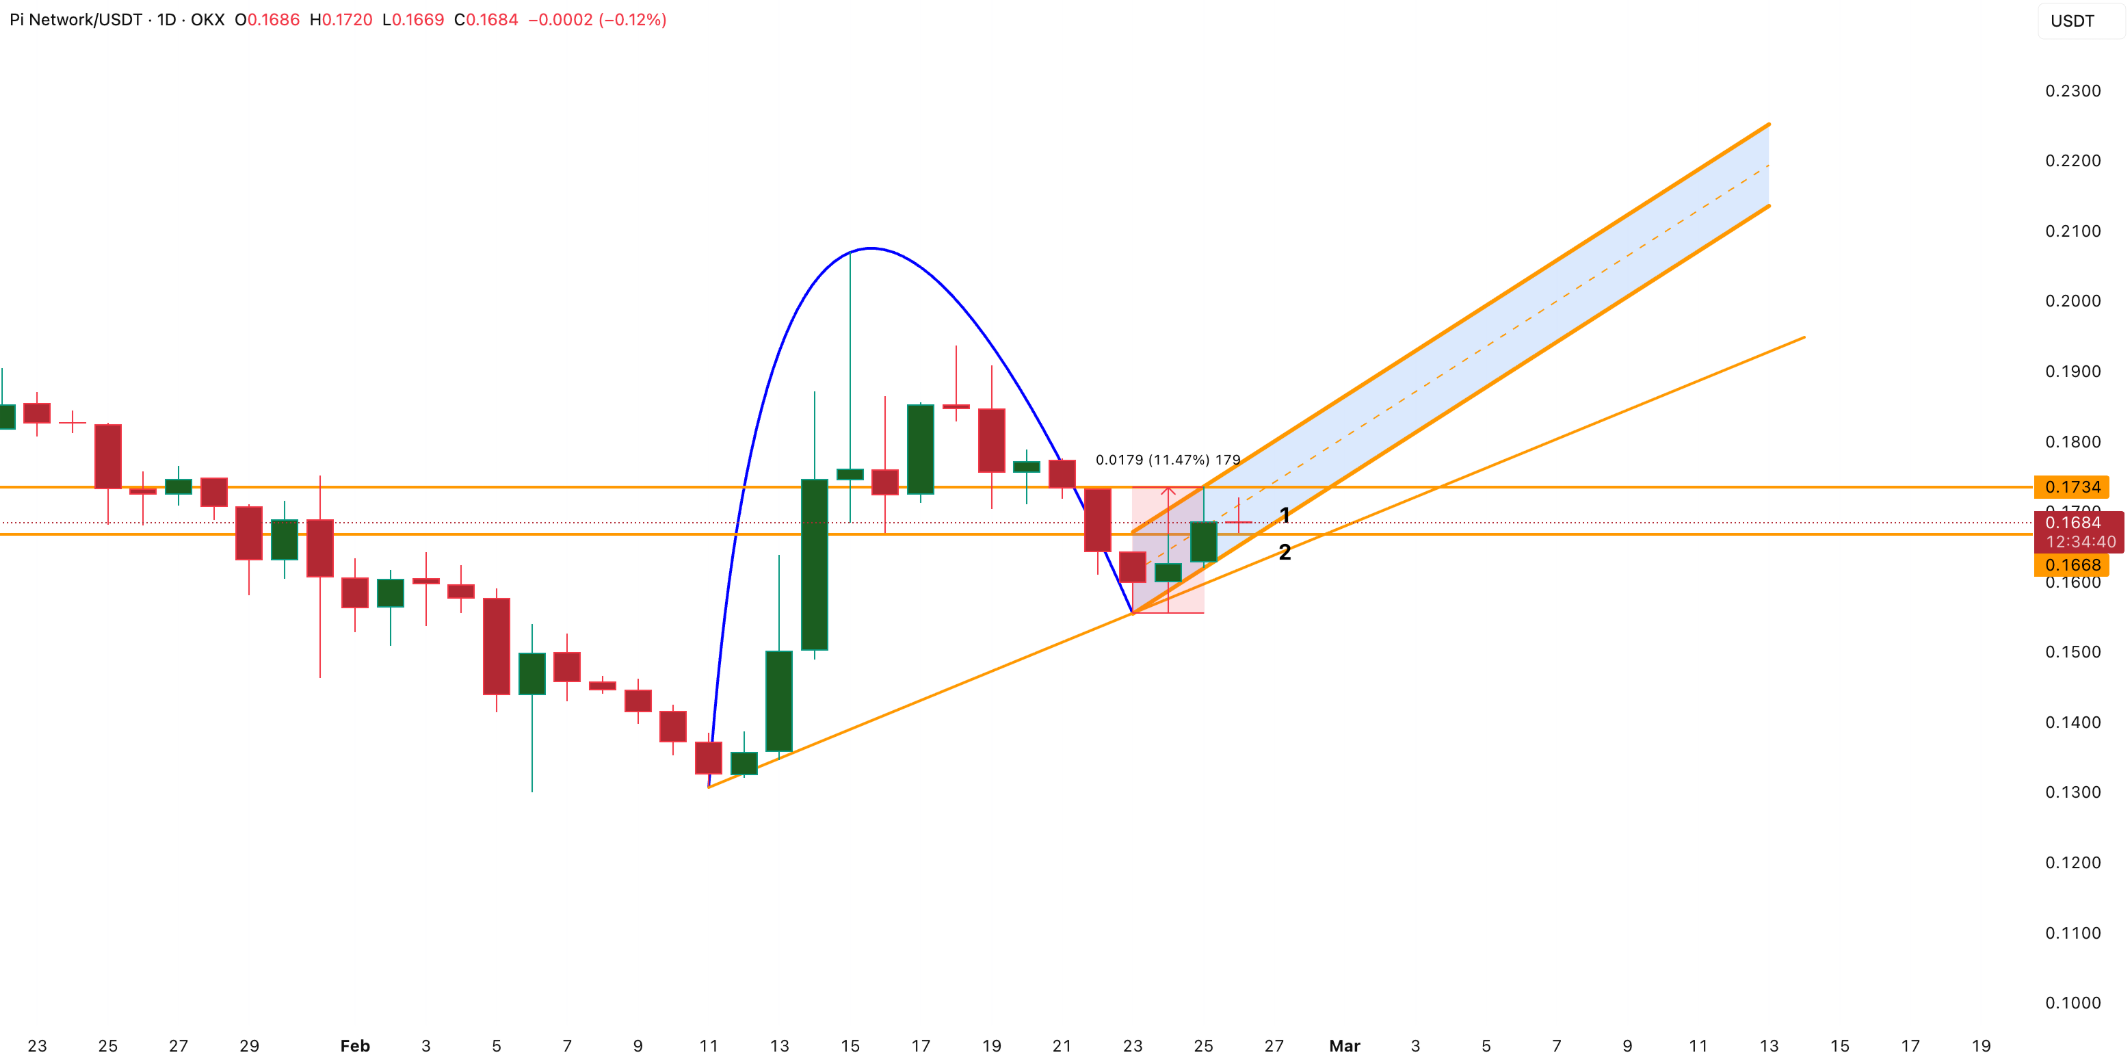
Pi Coin has recently seen a promising bounce. Since hitting a local low on February 23, the asset has climbed roughly 11 percent, bringing its price back up to the 0.174 USD zone. On the surface, this kind of recovery looks fantastic. It signals strength and naturally attracts fresh buyers who are hoping for a massive breakout.
However, before you jump in, it is crucial to look under the hood. This rebound might not be a bullish signal at all. In fact, multiple technical indicators suggest this could be the final phase of a dangerous bearish setup. While everyday retail traders are eagerly buying the dip, deeper market data reveals a troubling weakness.
The Inverted Cup and Handle Warning
Right now, the Pi Coin chart is forming what technical analysts call an inverted cup and handle. This is a notorious bearish structure that frequently precedes significant price drops. The current 11 percent rise essentially forms the handle of this pattern. These handle rebounds often look incredibly strong to the untrained eye, but they typically fail right at key resistance levels and lead to steep breakdowns.
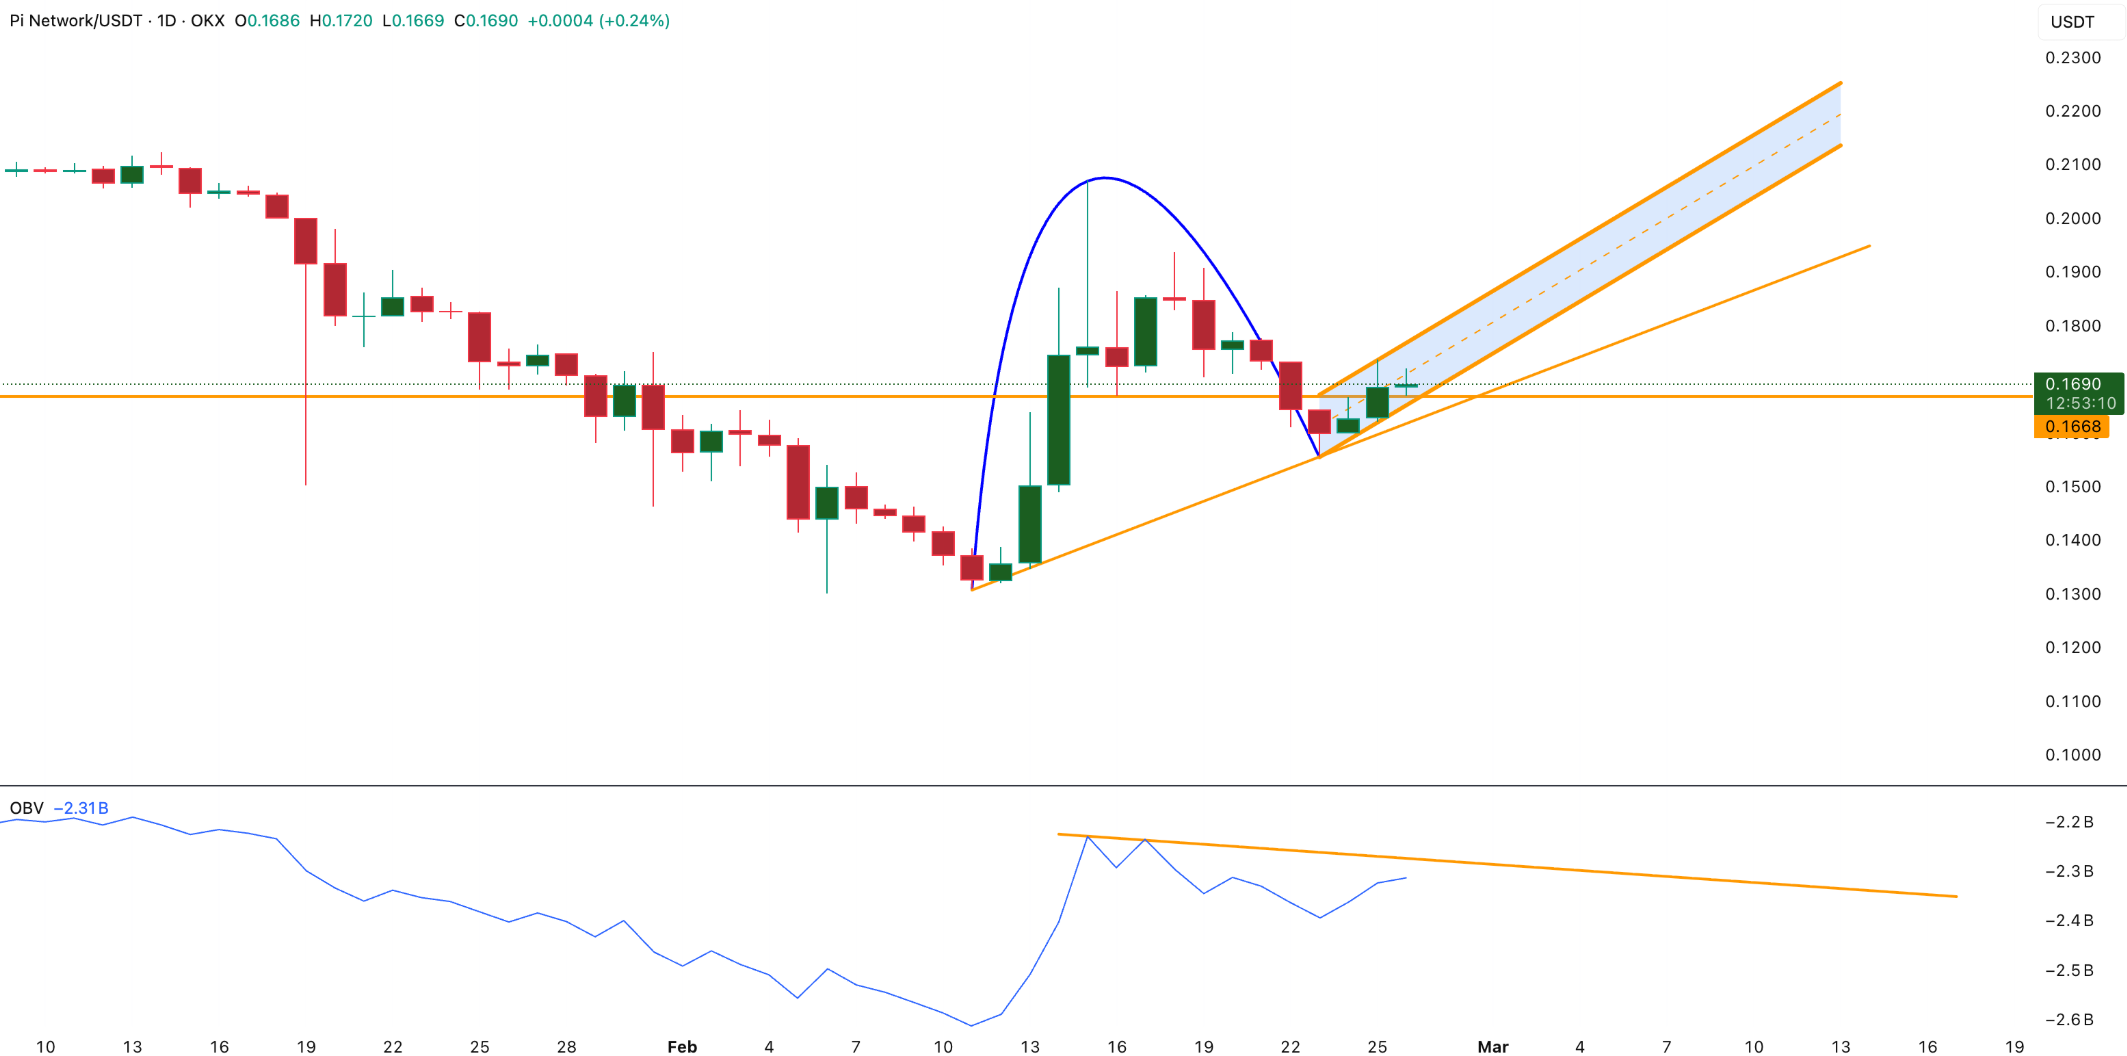
If we look at volume indicators, we see a fascinating and dangerous contradiction. The On Balance Volume metric, which tracks overall buying and selling pressure, has been rising steadily since February 23. This tells us that retail traders are actively buying the dip and trying to support the network token.
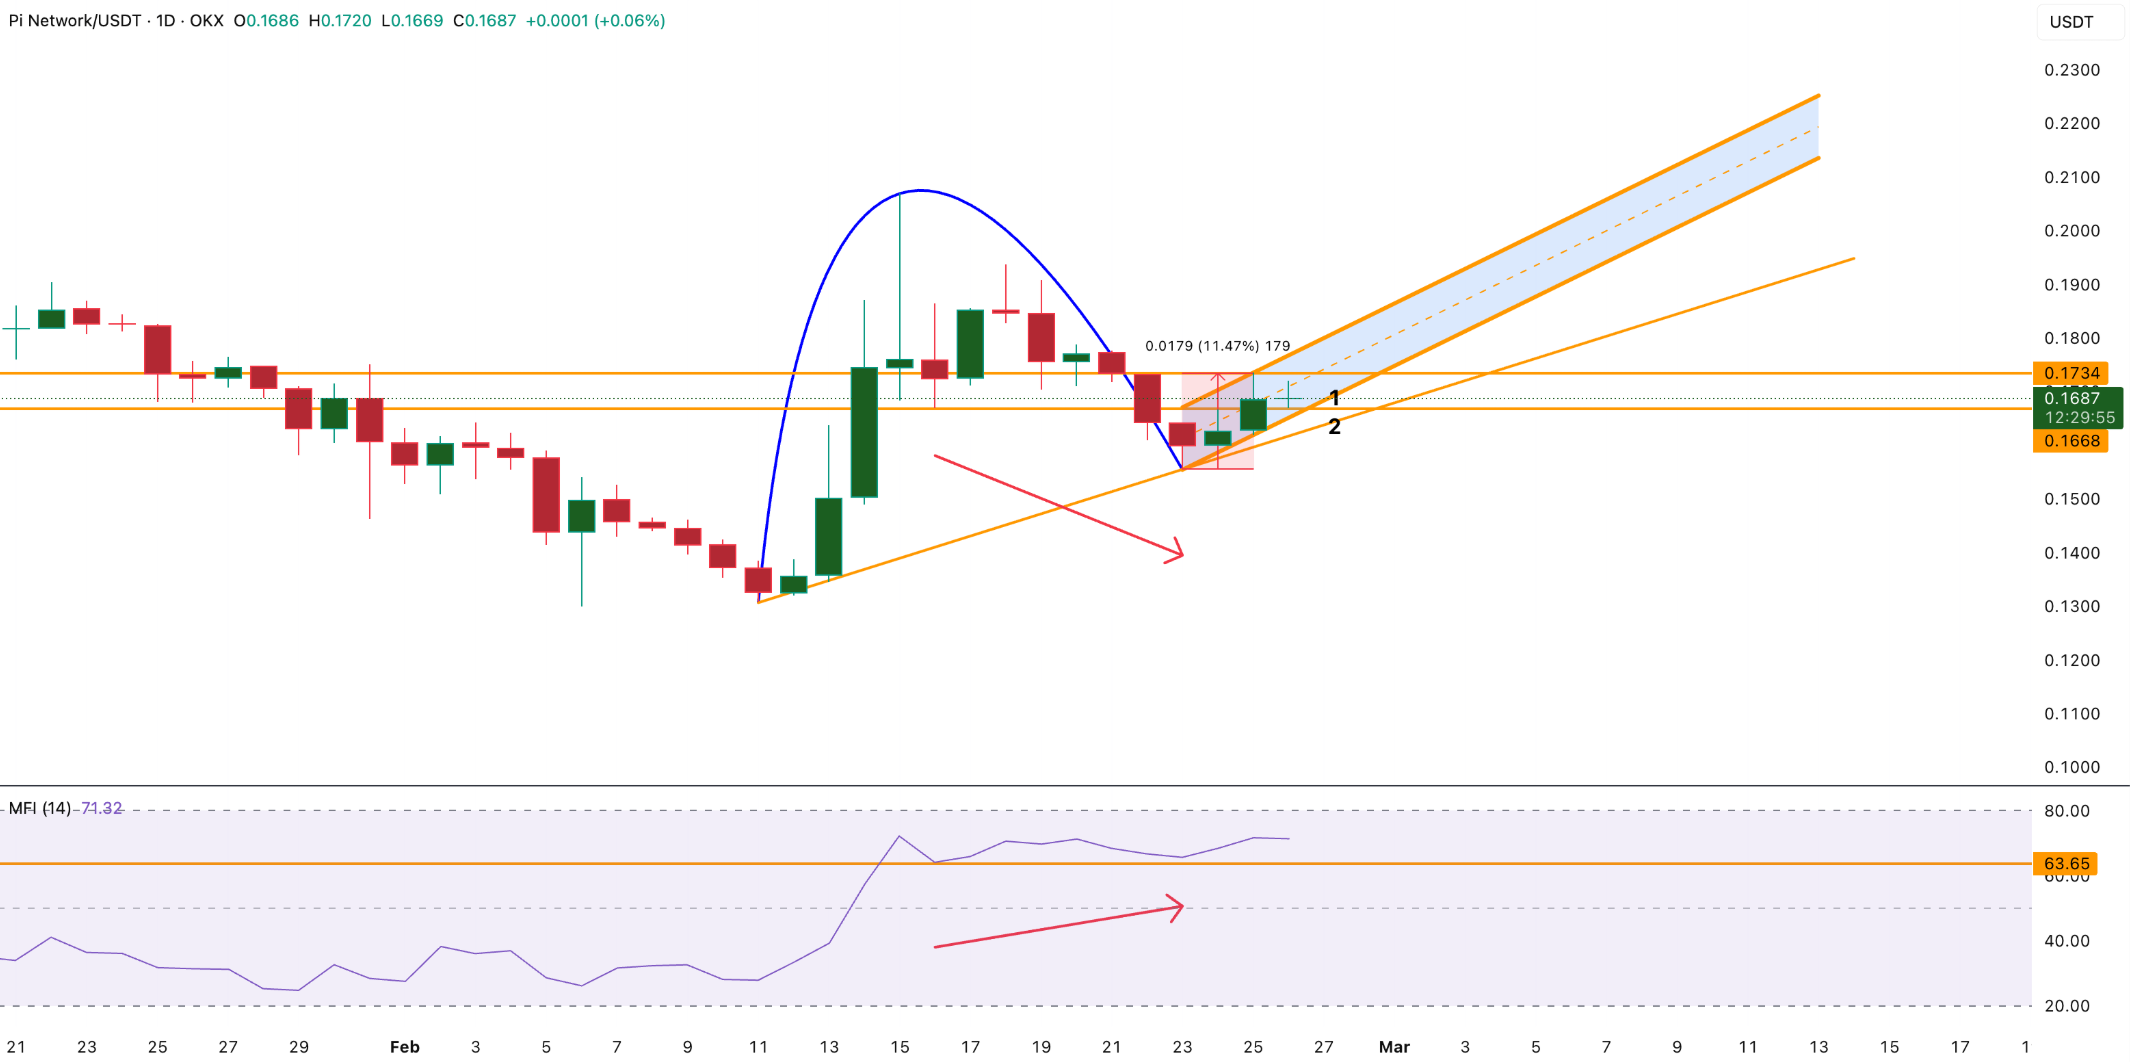
The Money Flow Index confirms this exact trend. Between February 16 and February 23, the price of Pi Coin formed lower lows, yet the Money Flow Index formed higher lows. This creates a bullish divergence, meaning buying pressure was increasing even as the price fell. Retail traders are clearly accumulating.
But here is where the trap lies. While retail investors are buying, the big money is quietly exiting.
The Chaikin Money Flow indicator tracks whether large scale capital is flowing into or out of an asset. Currently, this metric is falling steadily and remains in negative territory, meaning overall capital is bleeding out of the Pi ecosystem. Even more alarming, between February 11 and February 24, the Pi Coin price trended higher while the Chaikin Money Flow trended lower.
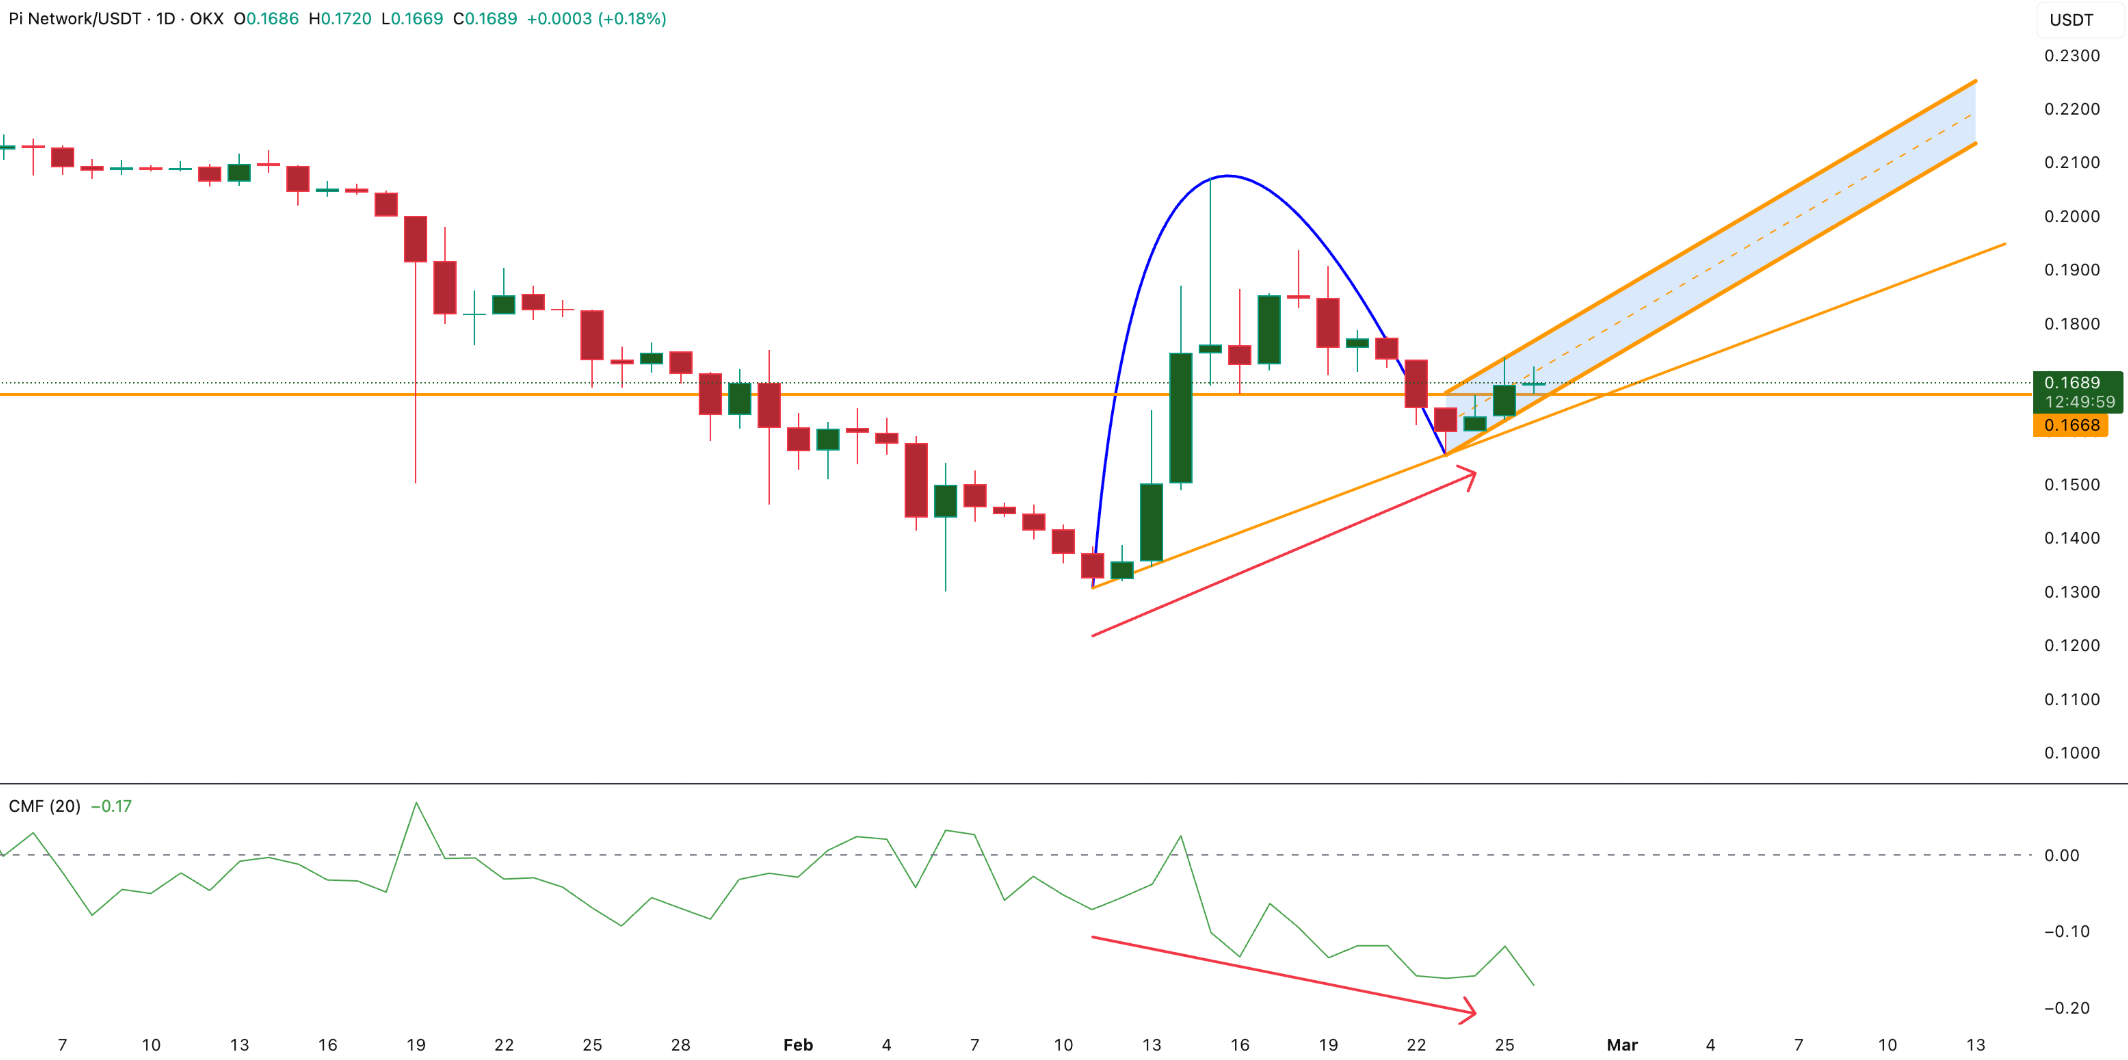
Data from TradingView highlights this bearish divergence perfectly. It strongly suggests that larger investors and whales are using this retail driven bounce as an exit strategy. Once the big money leaves, retail buying alone is rarely enough to sustain a rally.
Fading Momentum
The structural weakness becomes even more obvious when we look at market momentum. Between January 27 and February 25, the Pi Coin price formed a lower high. This means the current rebound is inherently weaker than the previous one, confirming the broader trend is still pointed firmly down.
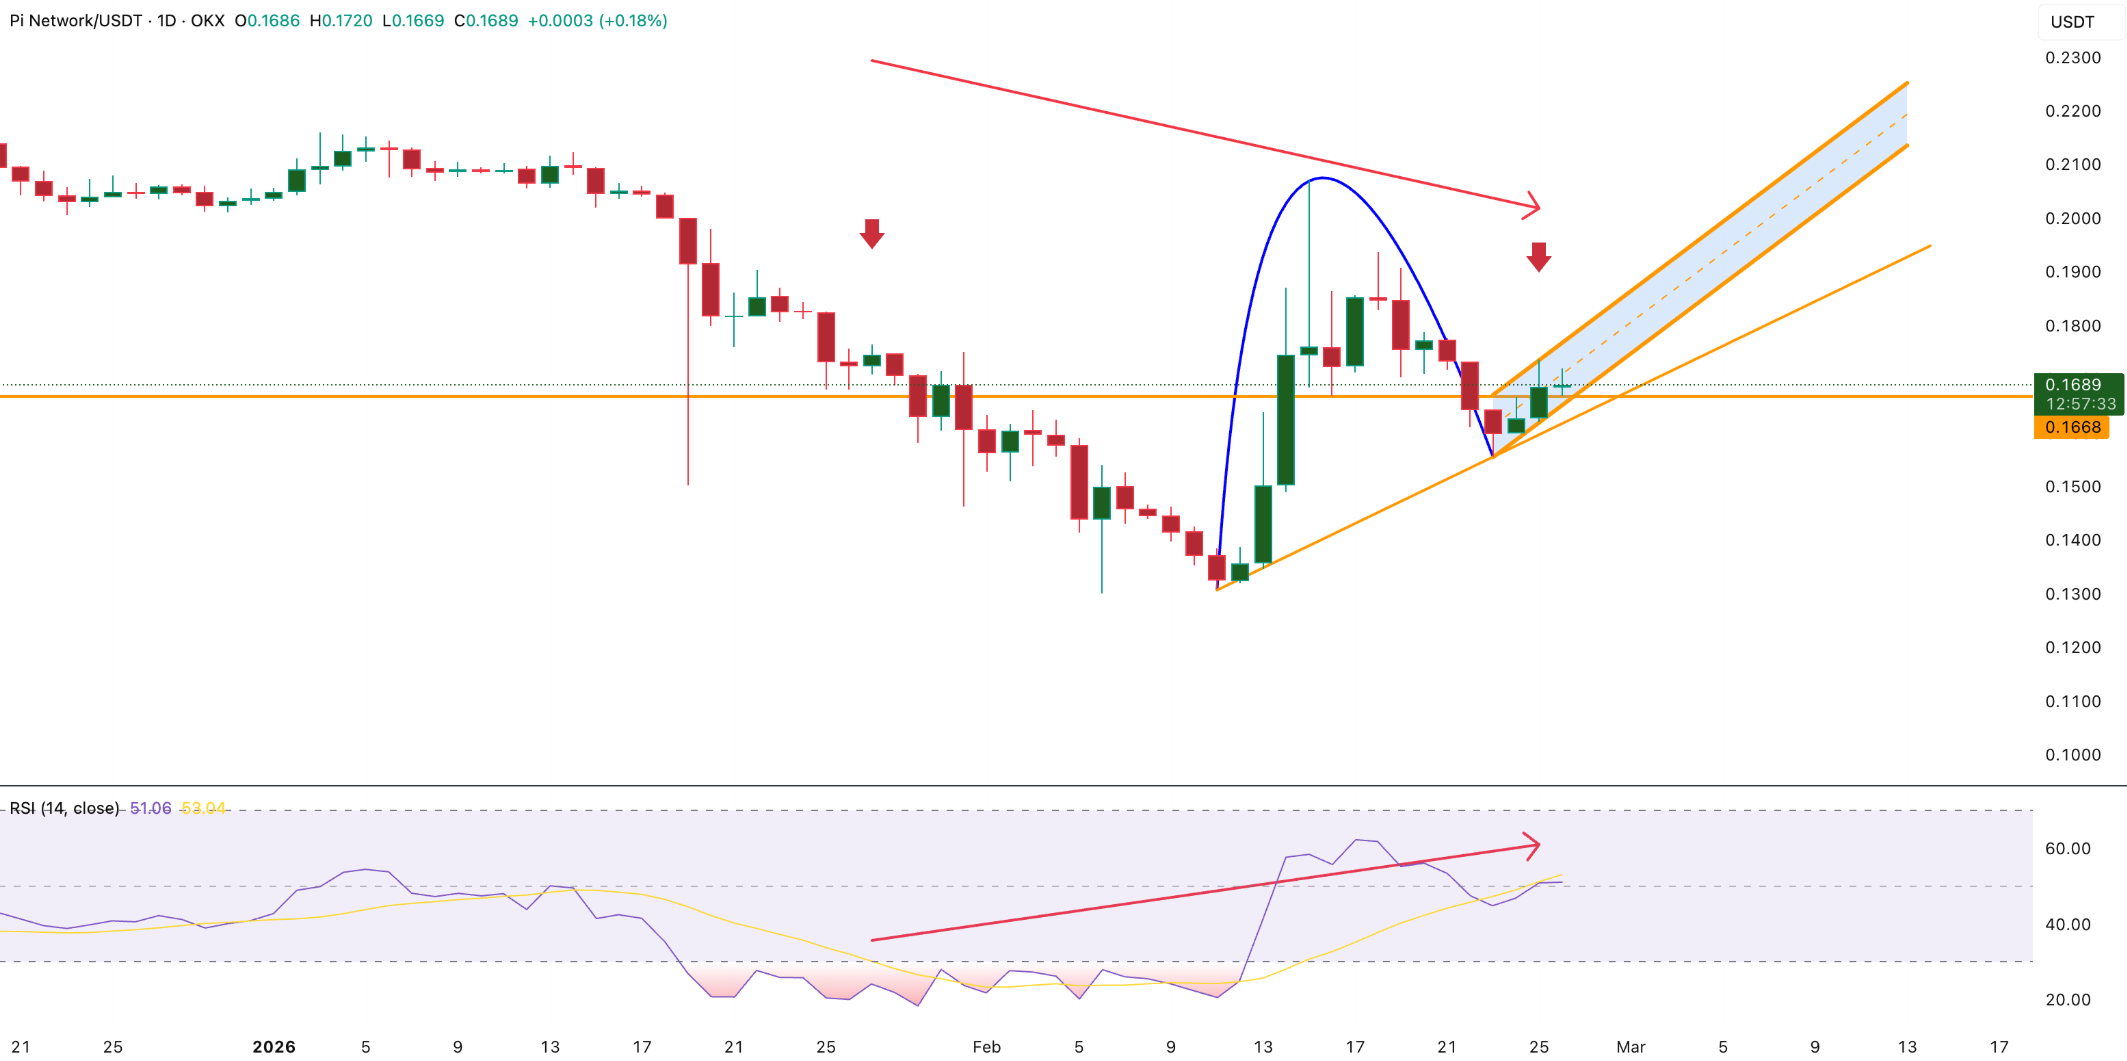
Simultaneously, the Relative Strength Index formed a higher high during that exact same window. This creates a hidden bearish divergence. Essentially, momentum is rising, but the actual price is failing to break resistance. This classic technical signal indicates that buyers are losing their grip and the current bounce may soon collapse.
Critical Price Levels to Watch
So, what happens next? Pi Coin is approaching a make or break moment.
If the price falls below the 0.161 USD support level, the bearish inverted cup and handle pattern will likely trigger. This breakdown could send the token tumbling back to its current low of 0.130 USD, and potentially down to a brand new low of 0.122 USD.
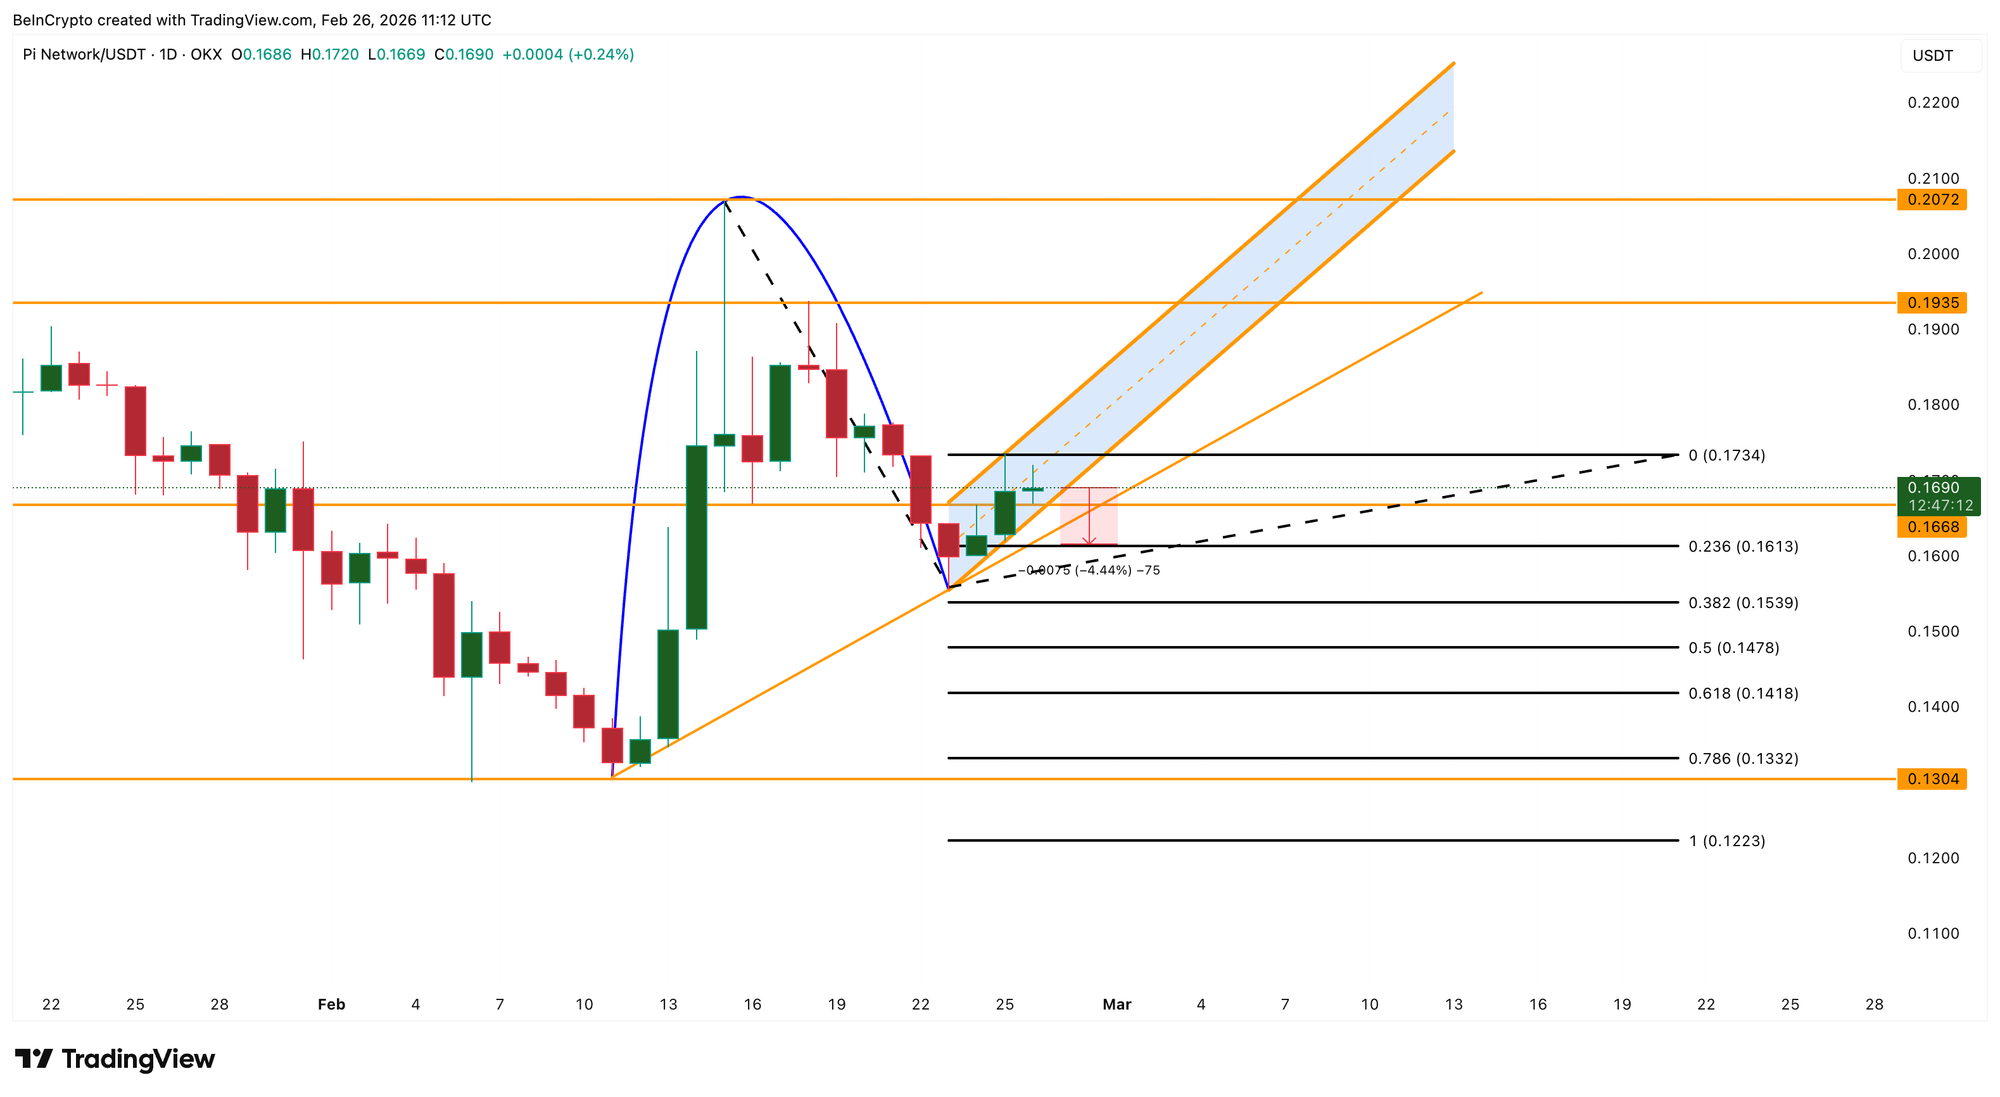
On the flip side, the bulls still have a chance to invalidate this grim outlook. A solid push above 0.173 USD would show early signs of returning strength. Breaking past 0.193 USD would severely weaken the bearish pattern. Finally, a decisive move above 0.207 USD would completely destroy the bearish thesis and confirm a true market recovery.
Until those higher resistance levels are firmly conquered, investors should exercise extreme caution.


