
If you strip away the complex indicators, the news hype, and the social media noise, trading often comes down to two simple questions: Where are the buyers? And where are the sellers?
In technical analysis, the answers to these questions are found in Support and Resistance. These are not just lines on a chart; they are the battlegrounds where supply and demand clash. Mastering them is the single most important skill for any trader, whether you are scalping Bitcoin or investing in tech stocks.
The Floor and the Ceiling
To visualize these concepts, imagine a person jumping up and down in a multi-story building.
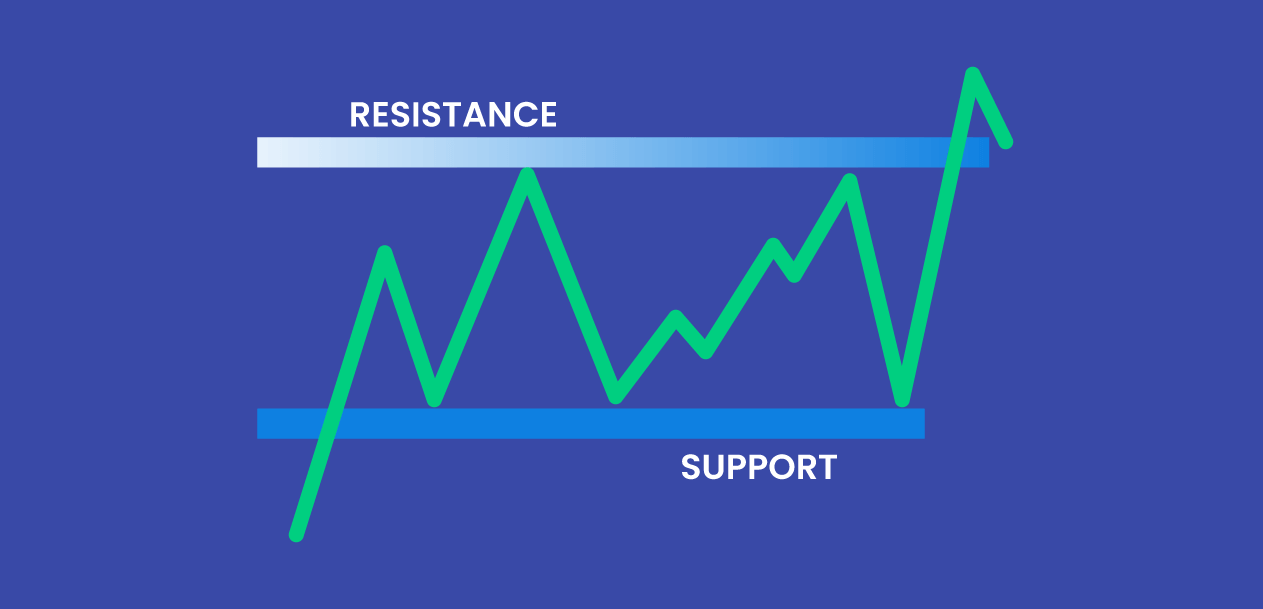
- Support (The Floor): This is a price level where a falling price tends to stop and bounce back up. Why? Because as the price gets cheaper, buyers (bulls) step in, perceiving value. Their demand absorbs the selling pressure, creating a "floor."
- Resistance (The Ceiling): This is a price level where a rising price tends to stop and drop back down. As the price gets expensive, sellers (bears) step in to take profits. Their supply overwhelms the buyers, creating a "ceiling."
It’s a Zone, Not a Laser Beam
One of the most common mistakes new traders make is treating these levels as exact numbers (e.g., "Bitcoin will bounce exactly at $50,000").
In reality, markets are messy. Prices often dip slightly below support or poke above resistance before reversing. This is why experienced traders view them as zones or areas rather than thin lines. A wick poking through a level doesn't always mean the level is broken; often, it’s just the market "testing" the water.
The "Flip": When Roles Reverse
What happens when the jumper on the trampoline finally jumps high enough to smash through the ceiling? They land on the floor above.
This is known as the Support/Resistance Flip (S/R Flip).
- Resistance becomes Support: When a price finally breaks above a tough resistance level, that old ceiling often becomes the new floor. Buyers who missed the breakout wait for the price to come back down to this level to enter, turning it into support.
- Support becomes Resistance: Conversely, if the price crashes through the floor, that old safety net often becomes a hard ceiling that prevents the price from recovering.
How to Find These Hidden Levels
You don't need a crystal ball to find these zones; you just need the right tools.
1. Horizontal Lines (The Gold Standard)
The simplest and most effective tool. Look for price levels where the market has reacted historically.
- Psychological Levels: Humans love round numbers. Prices often react at clear milestones like $10,000, $50,000, or $1.00 simply because people place their sell orders there.
- Swing Highs/Lows: Look for previous peaks and valleys. If the price struggled to get past $65,000 last month, it will likely struggle there again today.
2. Trendlines (Dynamic Angles)
Markets rarely move in straight horizontal lines. In an uptrend or downtrend, support and resistance move diagonally.
- Drawing them: Connect at least two (ideally three) lows in an uptrend to find your dynamic support. Connect the highs in a downtrend to find your dynamic resistance.
- The Channel: If you have parallel support and resistance lines, you have a "channel." Trading the channel involves buying at the bottom line and selling at the top line.
3. Moving Averages (Automated Support)
Indicators like the Moving Average (MA) smooth out price data to create a single flowing line. In a strong trend, the price will often bounce off key averages (like the 50-day or 200-day MA) as if they were physical barriers.
Determining Strength: Which Lines Matter?
Not all lines are created equal. How do you know if a support level is made of concrete or straw?
- Touch Count: The more times a price touches a level and bounces, the stronger that level is. It proves the market respects that zone.
- Timeframe: A resistance level on a Weekly or Monthly chart is significantly stronger than one on a 5-minute chart.
- Volume: If a price approaches a level and bounces with high trading volume, it confirms that big players (whales/institutions) are defending that area.


