
In the world of crypto trading, we often hear about "support," "resistance," and "price targets." But how do professional traders know exactly where a price will stop falling or how high it will bounce?
Often, they are using a tool that dates back to 13th-century Italy.
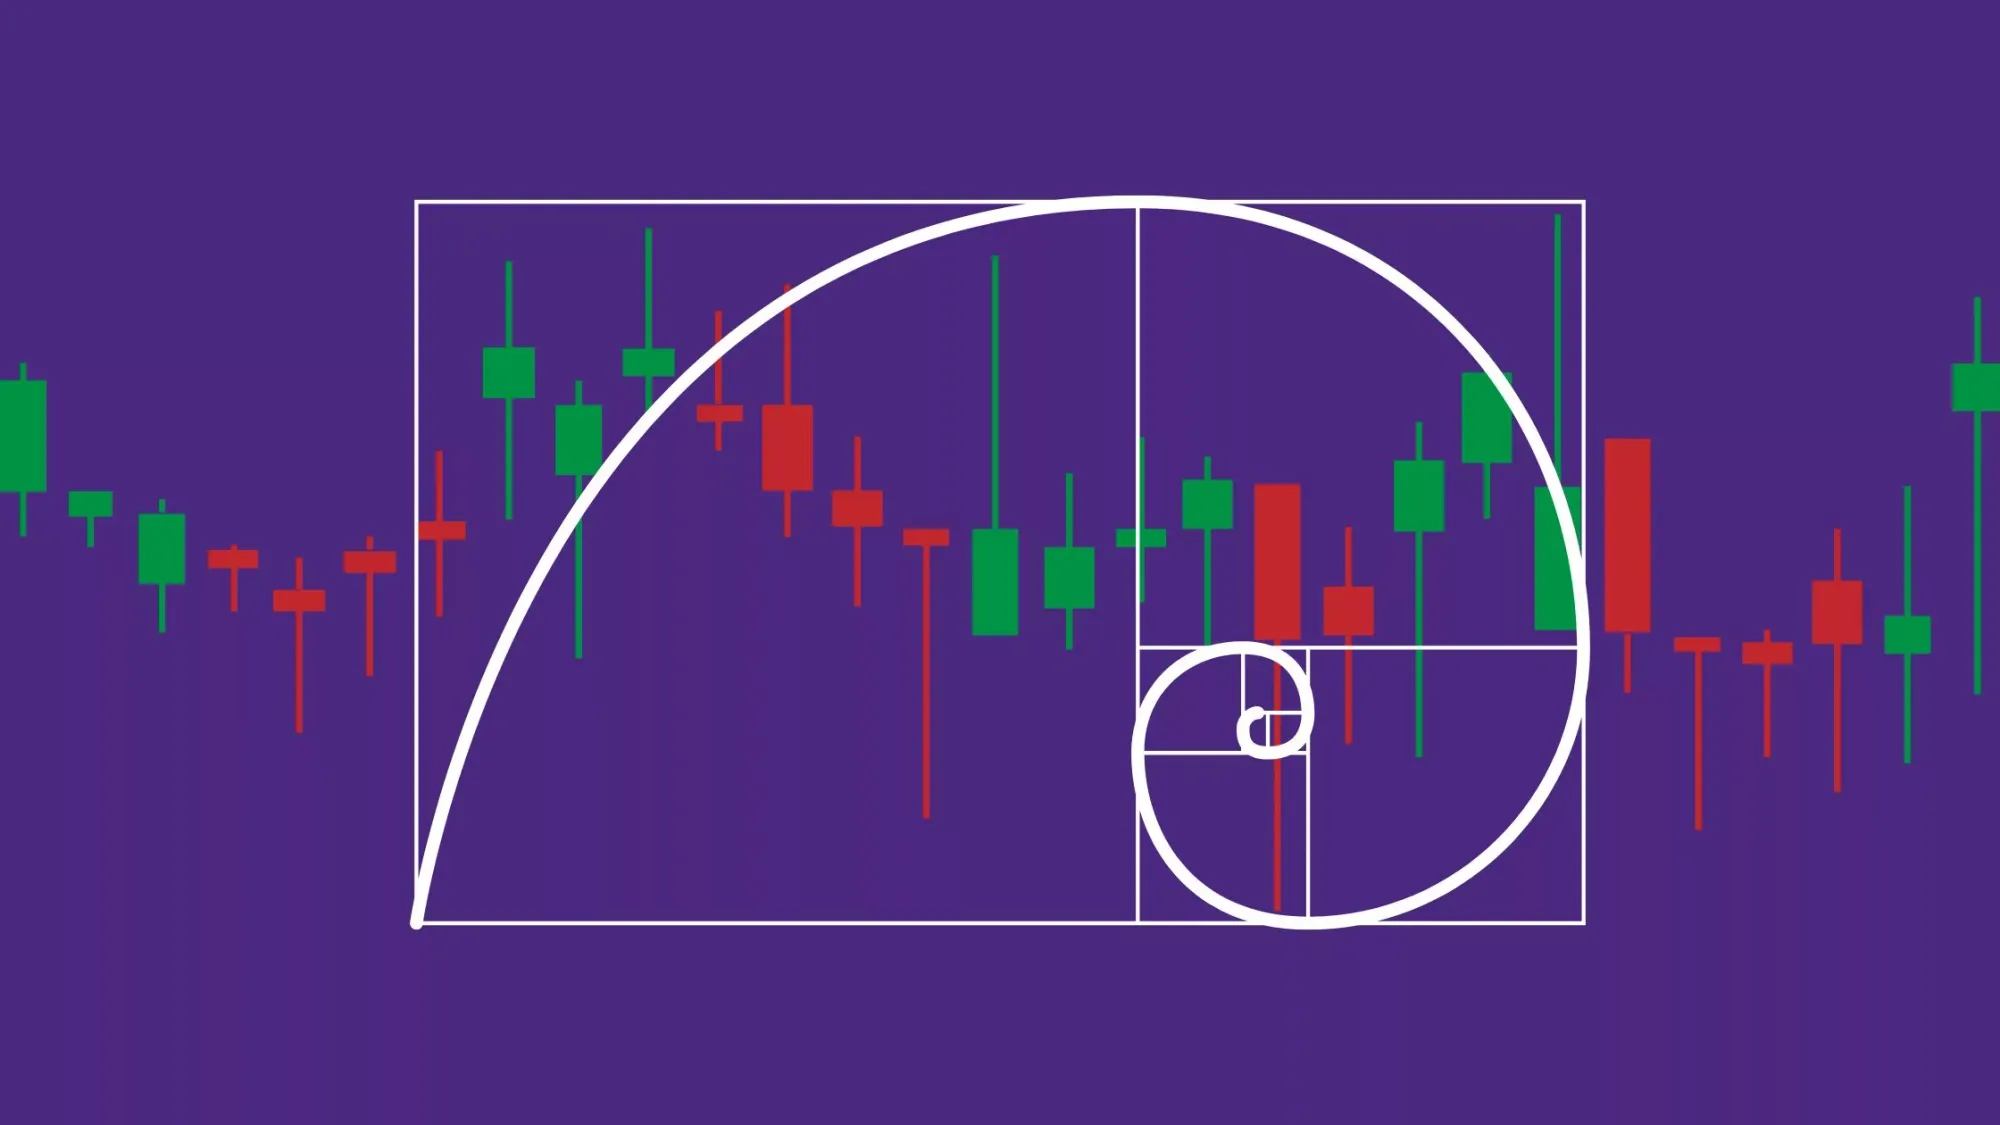
Fibonacci levels are one of the most popular tools in a technical analyst's arsenal. Based on a mathematical sequence found in nature—from snail shells to galaxy spirals—these ratios also appear remarkably often in financial markets.
Here is how you can use this ancient math to level up your trading game.
The Secret Sauce: The Golden Ratio
We won't bore you with a math lecture, but here is the gist: The Fibonacci sequence starts with 0 and 1, and each subsequent number is the sum of the two before it (0, 1, 1, 2, 3, 5, 8, 13...).
When you divide a number in this sequence by the one that follows it, you eventually get 0.618. This is the Golden Ratio. In trading, we call it the "Golden Pocket." It is the most watched level on any chart because it acts as a self-fulfilling prophecy: so many traders are waiting to buy there that the price often bounces exactly at that spot.
The Two Tools You Need to Know
In your charting software (like TradingView), you will see many Fibonacci tools. You only need to focus on two for now.
1. Fibonacci Retracement (The Safety Net)
- What it does: Measures how far a price might "pull back" (retrace) before continuing its trend.
- Analogy: Imagine dropping a tennis ball. It falls, hits the floor, and bounces back up. The Retracement tool measures the height of that bounce.
- Key Levels:
- 0.382: A shallow pullback (strong trend).
- 0.50: The halfway point (psychologically important).
- 0.618: The Golden Pocket (the ideal entry zone).
2. Fibonacci Extension (The Moonshot)
- What it does: Predicts where the price might go after it breaks an all-time high or low.
- Analogy: If the tennis ball bounces higher than the roof, where does it stop?
- Key Levels:
- 1.618: The primary target for a breakout.
- 2.618: An extended target for a massive rally.
How to Draw It Correctly
This is where 90% of beginners fail. To get the right levels, you must identify the Swing High and Swing Low.
- Swing High: A peak candle with lower highs on both its left and right.
- Swing Low: A bottom candle with higher lows on both its left and right.
The Rule of Thumb:
- In an Uptrend: Click on the Swing Low (bottom) and drag the cursor to the Swing High (top). You are measuring the dip.
- In a Downtrend: Click on the Swing High (top) and drag the cursor to the Swing Low (bottom). You are measuring the bounce.
A Simple Fibonacci Trading Strategy
Step 1: The Setup Wait for a significant price move (e.g., Bitcoin rallies from 40k USD to 44k USD) and starts to cool off.
Step 2: The Draw Select the Fibonacci Retracement tool. Click the bottom (40k) and drag to the top (44k).
Step 3: The Entry (Buy) Place limit buy orders in the 0.5 to 0.618 zone. This is where the "smart money" often reloads their bags.
Step 4: The Stop-Loss Protect yourself. Place a stop-loss order just below the 0.786 level. If the price falls this far, the trend is likely broken, and you want to get out.
Step 5: The Exit (Sell) If the price bounces, take profit at the previous high (0 level) or use the 1.618 Extension as your "moon bag" target.
Final Reality Check
Fibonacci levels are like a GPS—they show you the likely route, but they don't drive the car. A level is just a line on a screen until buyers or sellers actually show up.


