
Cryptocurrency markets are famously volatile, often feeling like a rollercoaster ride for even the most seasoned investors. However, there is a way to make sense of the chaos. Technical analysis, commonly known as TA, provides traders with a roadmap to navigate these wild price swings. By studying historical price and volume data, you can uncover hidden trends and identify the exact moments to enter or exit a trade.
Before diving in, it is important to distinguish technical analysis from fundamental analysis. While fundamental analysis looks at the intrinsic value of an asset through economic conditions or project updates, technical analysis focuses purely on what the price charts are telling us.
The Psychology Behind Chart Patterns
When you look at a crypto chart, you are actually looking at the visual footprint of human emotion. Traders use these recurring chart patterns to make educated predictions about where an asset might head next. Here are a couple of the most reliable formations to watch for.
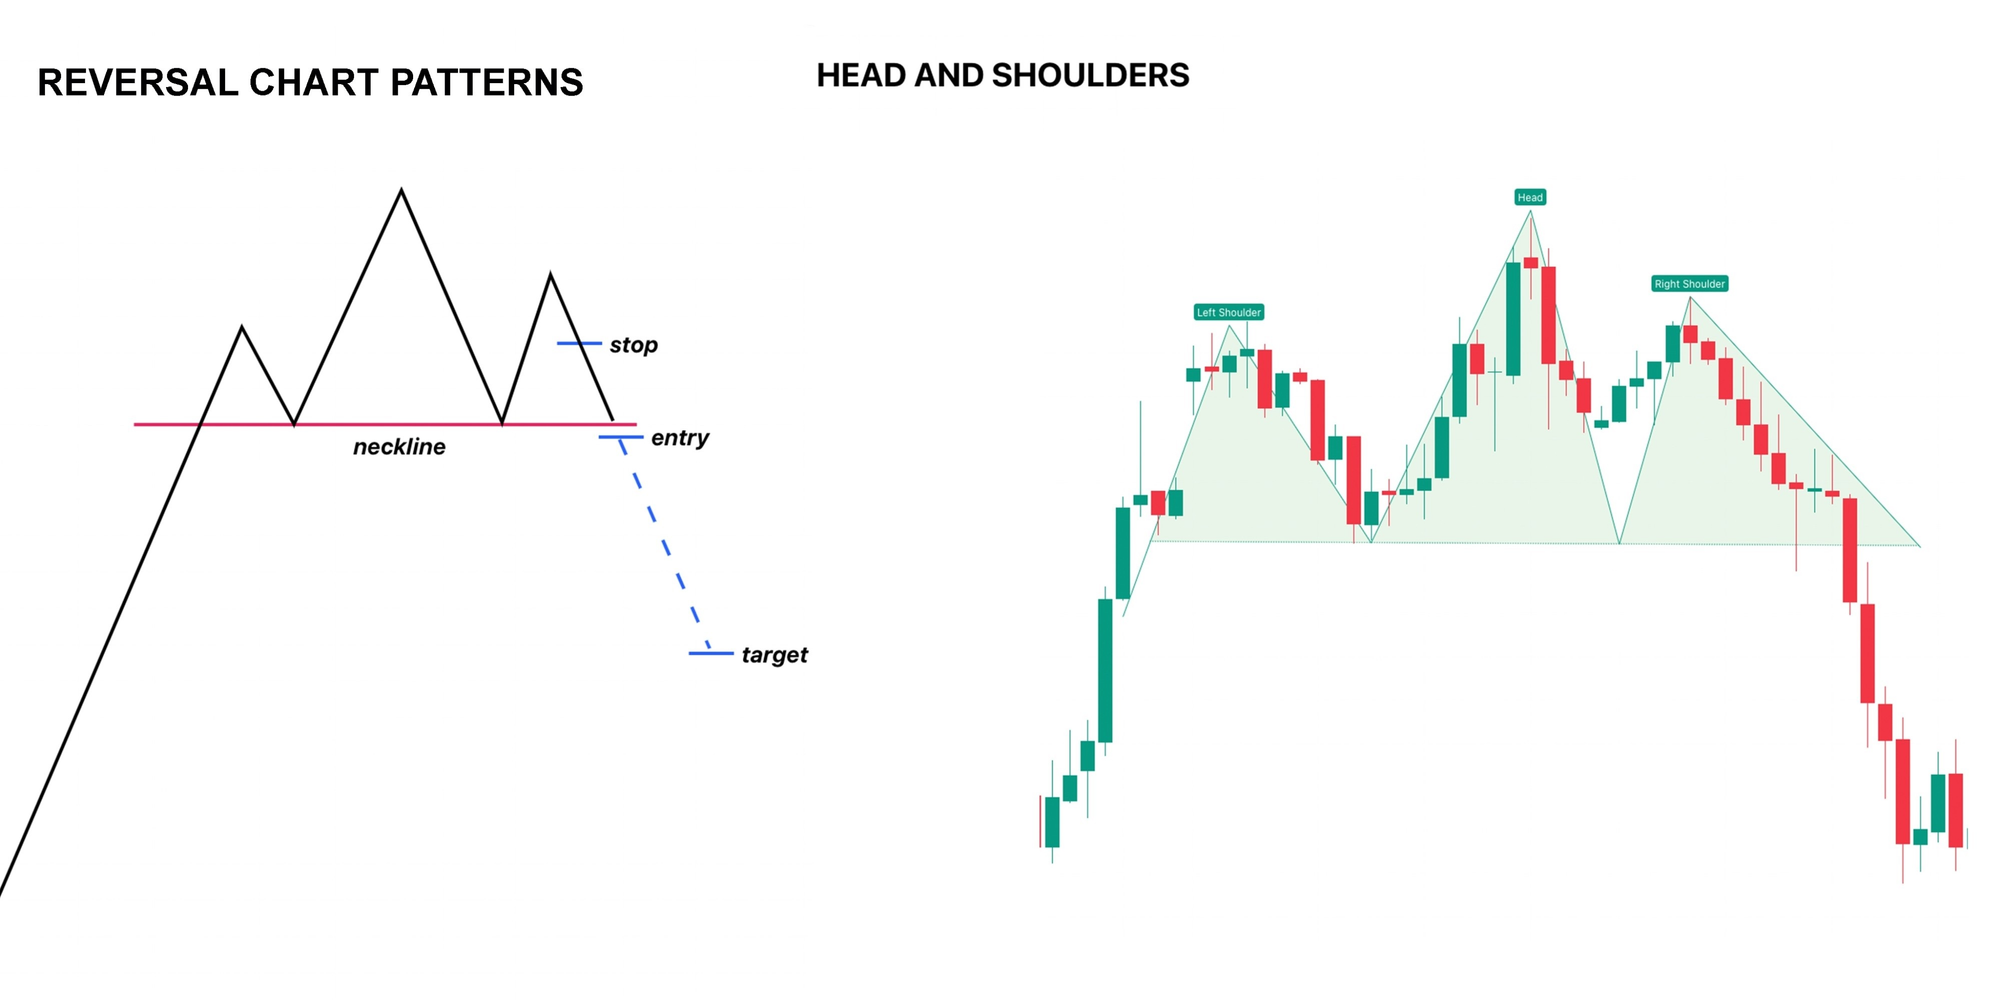
The Head and Shoulders Formation This classic pattern looks exactly like it sounds: a central peak (the head) flanked by two slightly lower peaks (the shoulders). A standard head and shoulders pattern usually appears at the end of a long uptrend, signaling that buyers are exhausted and a downward shift is imminent. Conversely, an inverse head and shoulders pattern appears at the bottom of a downtrend, hinting that a massive bullish reversal could be just around the corner.
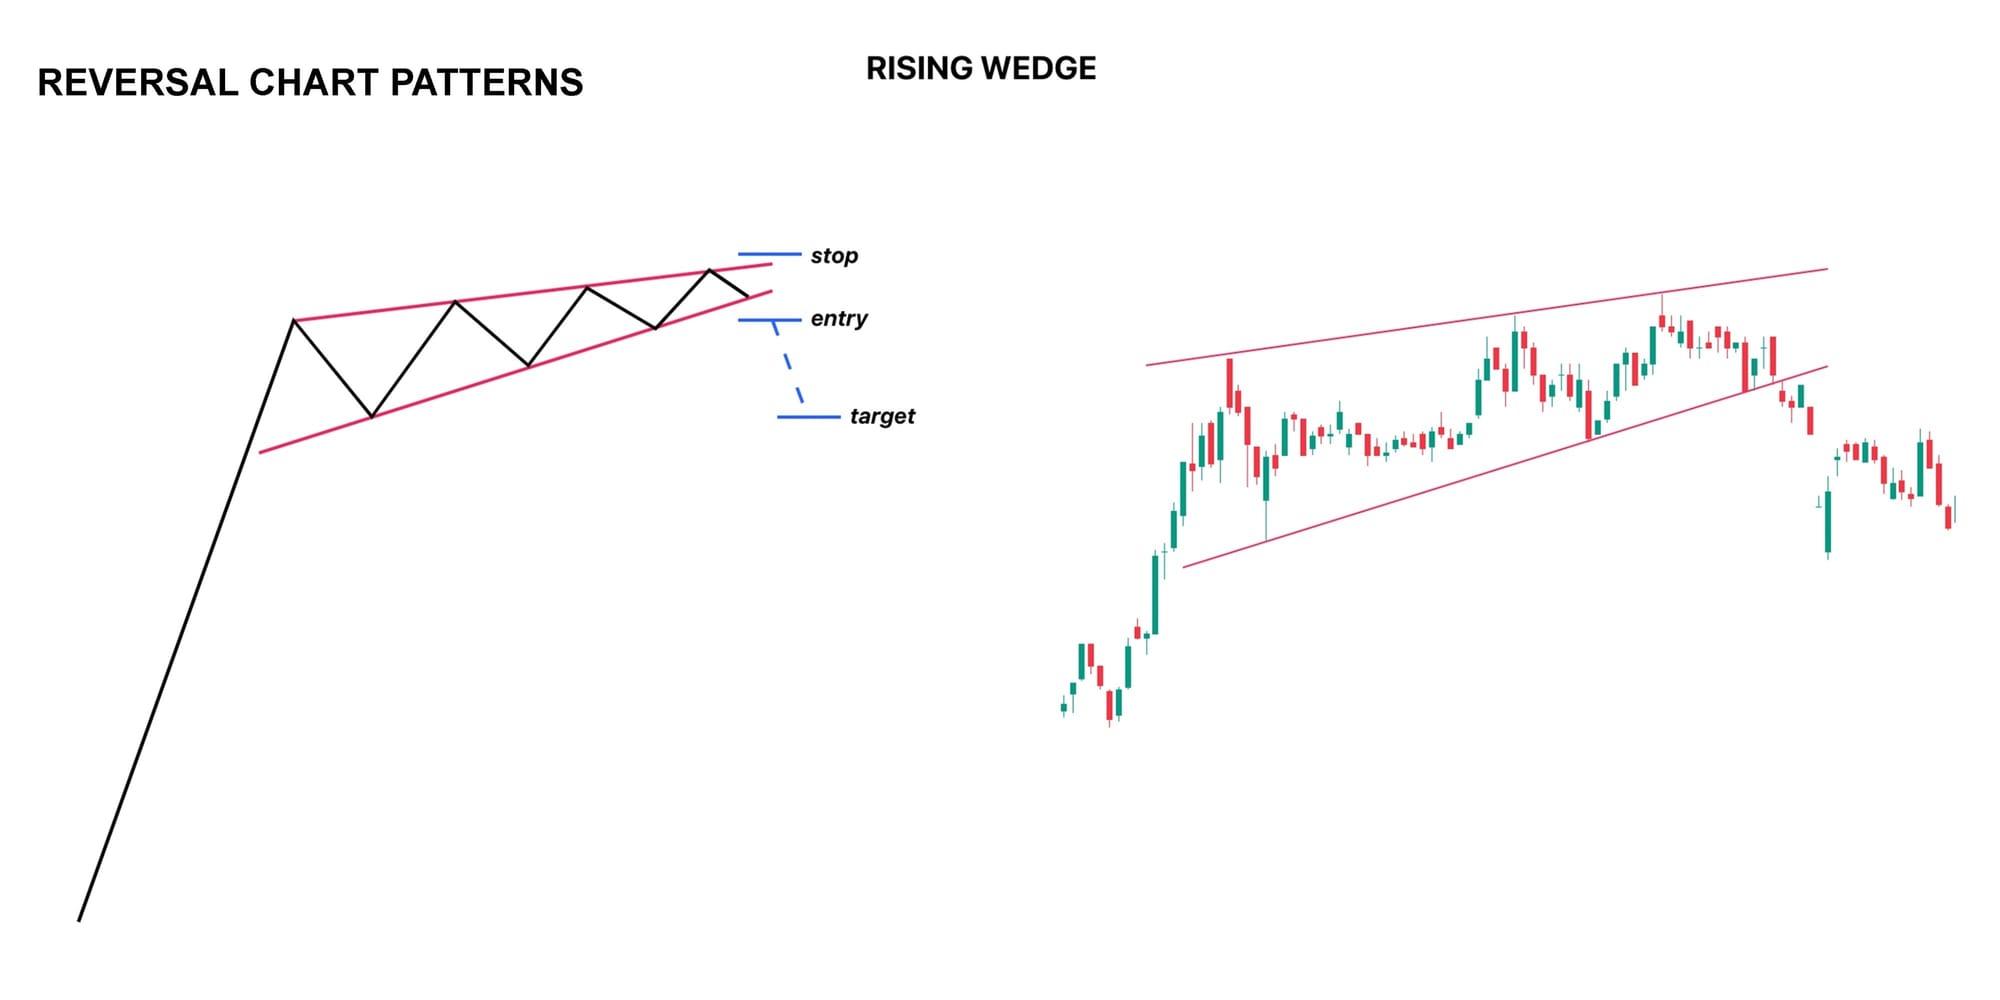
Triangles: The Coiled Springs of Crypto Triangle patterns form when an asset's price consolidates into an increasingly tight range. You can think of them like a coiled spring waiting to pop.
- Ascending triangles feature a flat resistance line on top and rising support on the bottom, generally acting as a bullish signal that prices will break upward.
- Descending triangles have a flat bottom and a falling top, which usually precedes a bearish drop.
- Symmetrical triangles show both lines converging equally, meaning a breakout could happen in either direction.
Advanced Technical Indicators
While chart patterns give you the big picture, technical indicators offer precise mathematical insights into momentum and trend strength. They are not crystal balls, but they are incredibly powerful when used correctly.
Moving Averages Moving averages smooth out erratic price data to help you identify the true trend and pinpoint key support or resistance levels.
- The Simple Moving Average, or SMA, calculates the average price over a specific number of days, treating every data point equally.
- The Exponential Moving Average, or EMA, gives much more weight to recent prices, making it react faster to sudden market shifts.
Traders love to watch for crossovers between different moving averages. A golden cross happens when a short term moving average crosses above a long term one, signaling a major bullish run. On the flip side, a death cross occurs when the short term line falls below the long term line, warning of a potential crash.
Relative Strength Index The Relative Strength Index, widely known as RSI, is a momentum gauge that measures how fast a cryptocurrency is changing in price. Operating on a scale from 0 to 100, the RSI tells you if an asset is overbought or oversold. If the RSI climbs above 70, the asset might be overvalued and due for a correction. If it drops below 30, the asset is considered oversold and might be ready for a bounce.
Moving Average Convergence Divergence The Moving Average Convergence Divergence, or MACD, is a favorite among professional traders because it tracks both trend direction and momentum simultaneously. It consists of three parts:
- The MACD line: The difference between a 12 period EMA and a 26 period EMA.
- The signal line: A 9 period EMA of the MACD line itself.
- The histogram: A visual representation of the gap between the first two lines.
When the MACD line crosses above the signal line, it is generally time to buy. When it crosses below, it is usually a signal to sell or take profits.
Building a Bulletproof Strategy
Technical analysis is an incredible skill, but smart traders know it is only one piece of the puzzle. Relying on a single indicator is risky in a market that never sleeps.
To truly protect your portfolio, you must combine technical analysis with strict risk management. Always set stop loss orders so you never lose more than you can afford on a single trade. Furthermore, diversifying your investments and keeping an eye on fundamental analysis will give you a much richer understanding of the market.


