
The Fibonacci sequence isn’t just a fascinating pattern from nature—it’s also a powerful tool in financial markets. Traders use it to anticipate price movements, identify support and resistance levels, and refine entry and exit strategies.
What Is the Fibonacci Sequence?
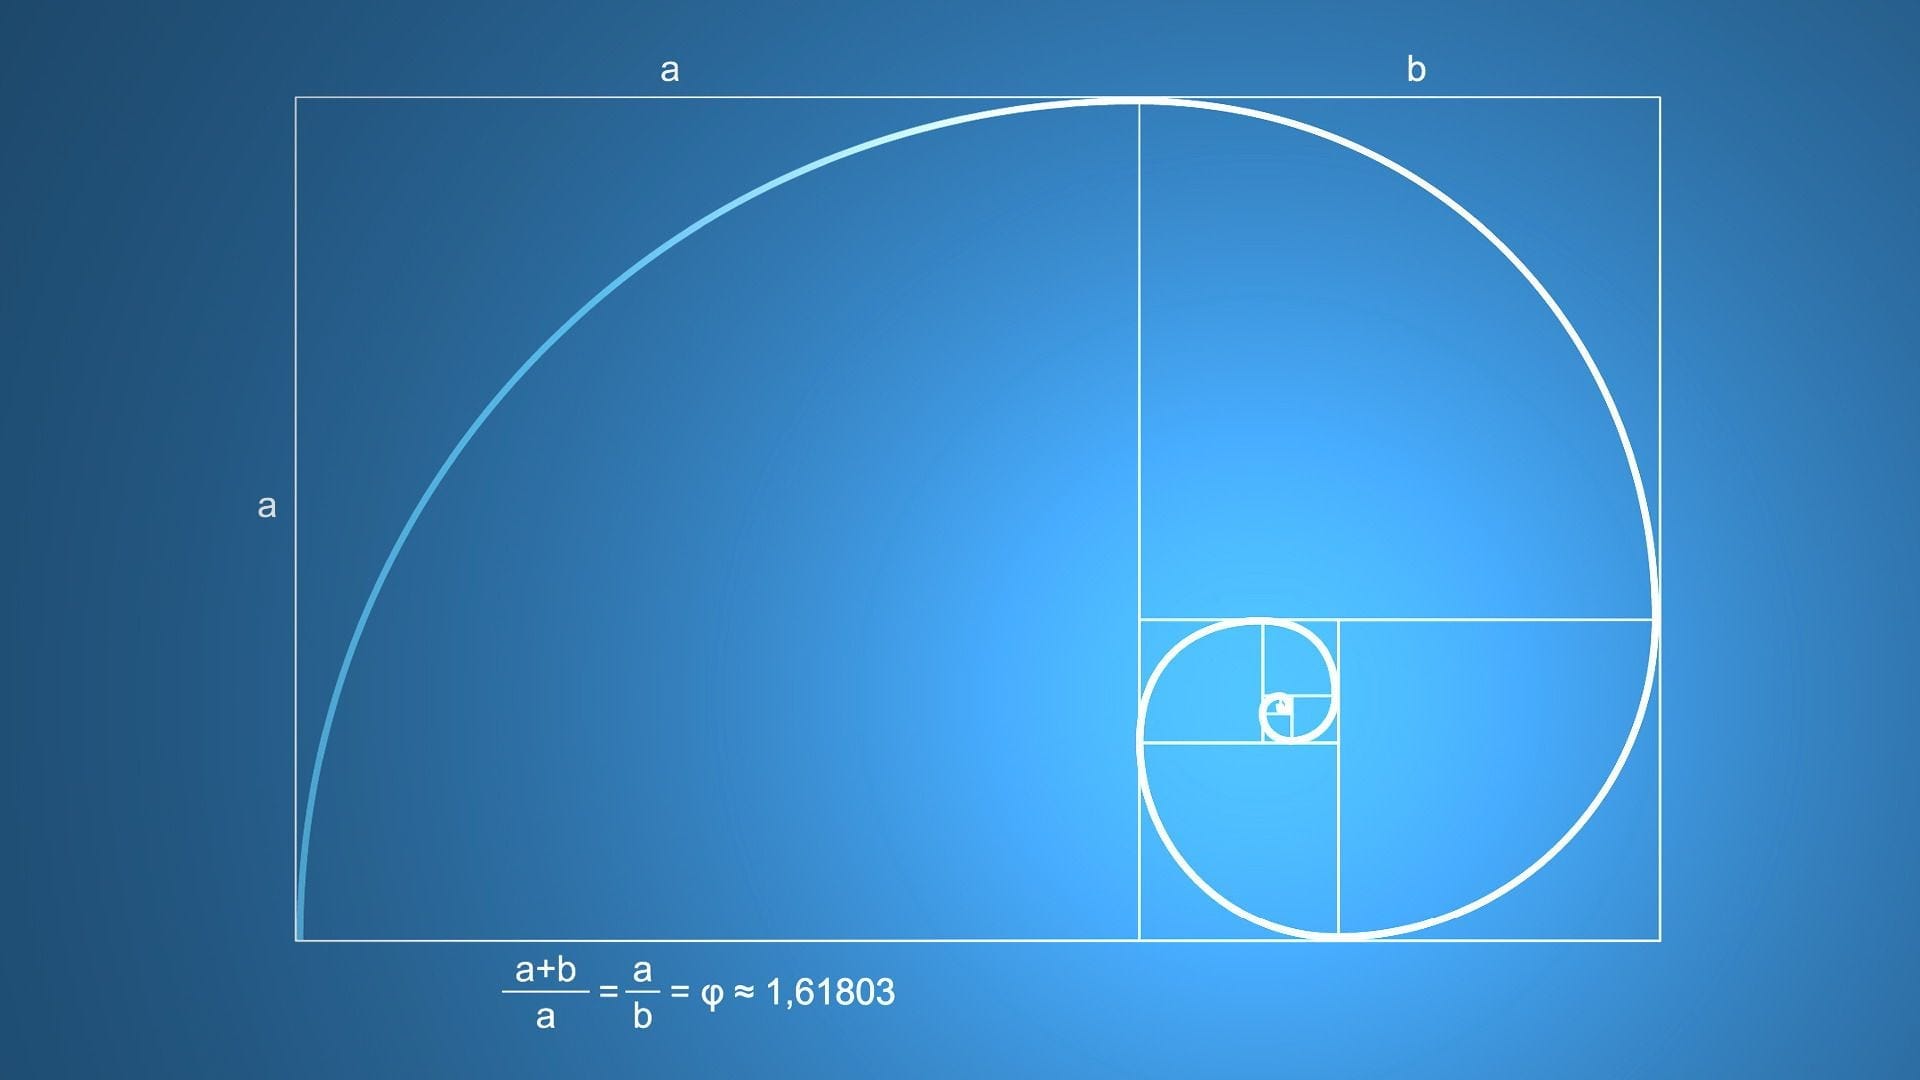
The Fibonacci sequence is a series of numbers where each number equals the sum of the two before it. It begins:
0, 1, 1, 2, 3, 5, 8, 13, 21…
As the sequence continues, the ratio between numbers approaches 1.618, also known as the Golden Ratio. This ratio appears in seashell spirals, sunflower petals, architecture, and even stock charts.
The sequence was first introduced by Italian mathematician Leonardo Fibonacci in 1202 in his book Liber Abaci. What started as a rabbit-breeding thought experiment has since become a cornerstone of modern trading analysis.
Fibonacci and Trading
In technical analysis, Fibonacci ratios are overlaid on price charts to predict where an asset might pause, reverse, or continue its trend. These levels are known as Fibonacci retracements.
Fibonacci Retracement Levels
Key retracement levels include:
- 23.6%
- 38.2%
- 50% (not technically a Fibonacci number, but widely used)
- 61.8%
- 78.6%
Here’s how they work:
If Bitcoin rallies $1,000 and then pulls back $236, that’s a 23.6% retracement. If it dips further, traders watch the next retracement lines—38.2% or 61.8%—to see if the asset finds support.
These levels often act as “psychological barriers,” where traders decide whether to buy the dip or take profits.
Fibonacci Extensions
Beyond retracements, traders also use Fibonacci extensions to project future price targets in an uptrend or downtrend. Common extension levels include 61.8%, 100%, 161.8%, 200%, and 261.8%. These help traders gauge where a strong move might run out of steam or continue into price discovery.
How Traders Use Fibonacci Levels
Fibonacci tools are flexible, but here are the most common applications:
- Finding entries: In an uptrend, a pullback to the 38.2% level might be a buy opportunity.
- Setting stop-loss orders: Traders often place stop-losses just below key retracement levels to limit losses if the price breaks down.
- Projecting targets: Using extension levels, traders estimate potential upside (or downside) once a trend resumes.
Key Takeaways
- The Fibonacci sequence is a centuries-old mathematical pattern with deep ties to nature, art, and financial markets.
- In trading, it helps identify support, resistance, and trend reversal points through retracements and extensions.
- Popular levels like 38.2%, 50%, and 61.8% serve as guideposts for both short-term trades and long-term strategies.
While Fibonacci levels aren’t foolproof—they work best when combined with other tools like volume analysis or moving averages—they remain one of the most widely used methods in technical analysis.


