

Ethereum is showing signs of life again. After touching a recent low near 1,840 USD, the second largest cryptocurrency has climbed roughly 4 percent. While this might look like a standard market fluctuation, a deeper look reveals that buyers are strategically stepping back in. This recovery has been quietly building for weeks, and the underlying data suggests a larger shift is underway.
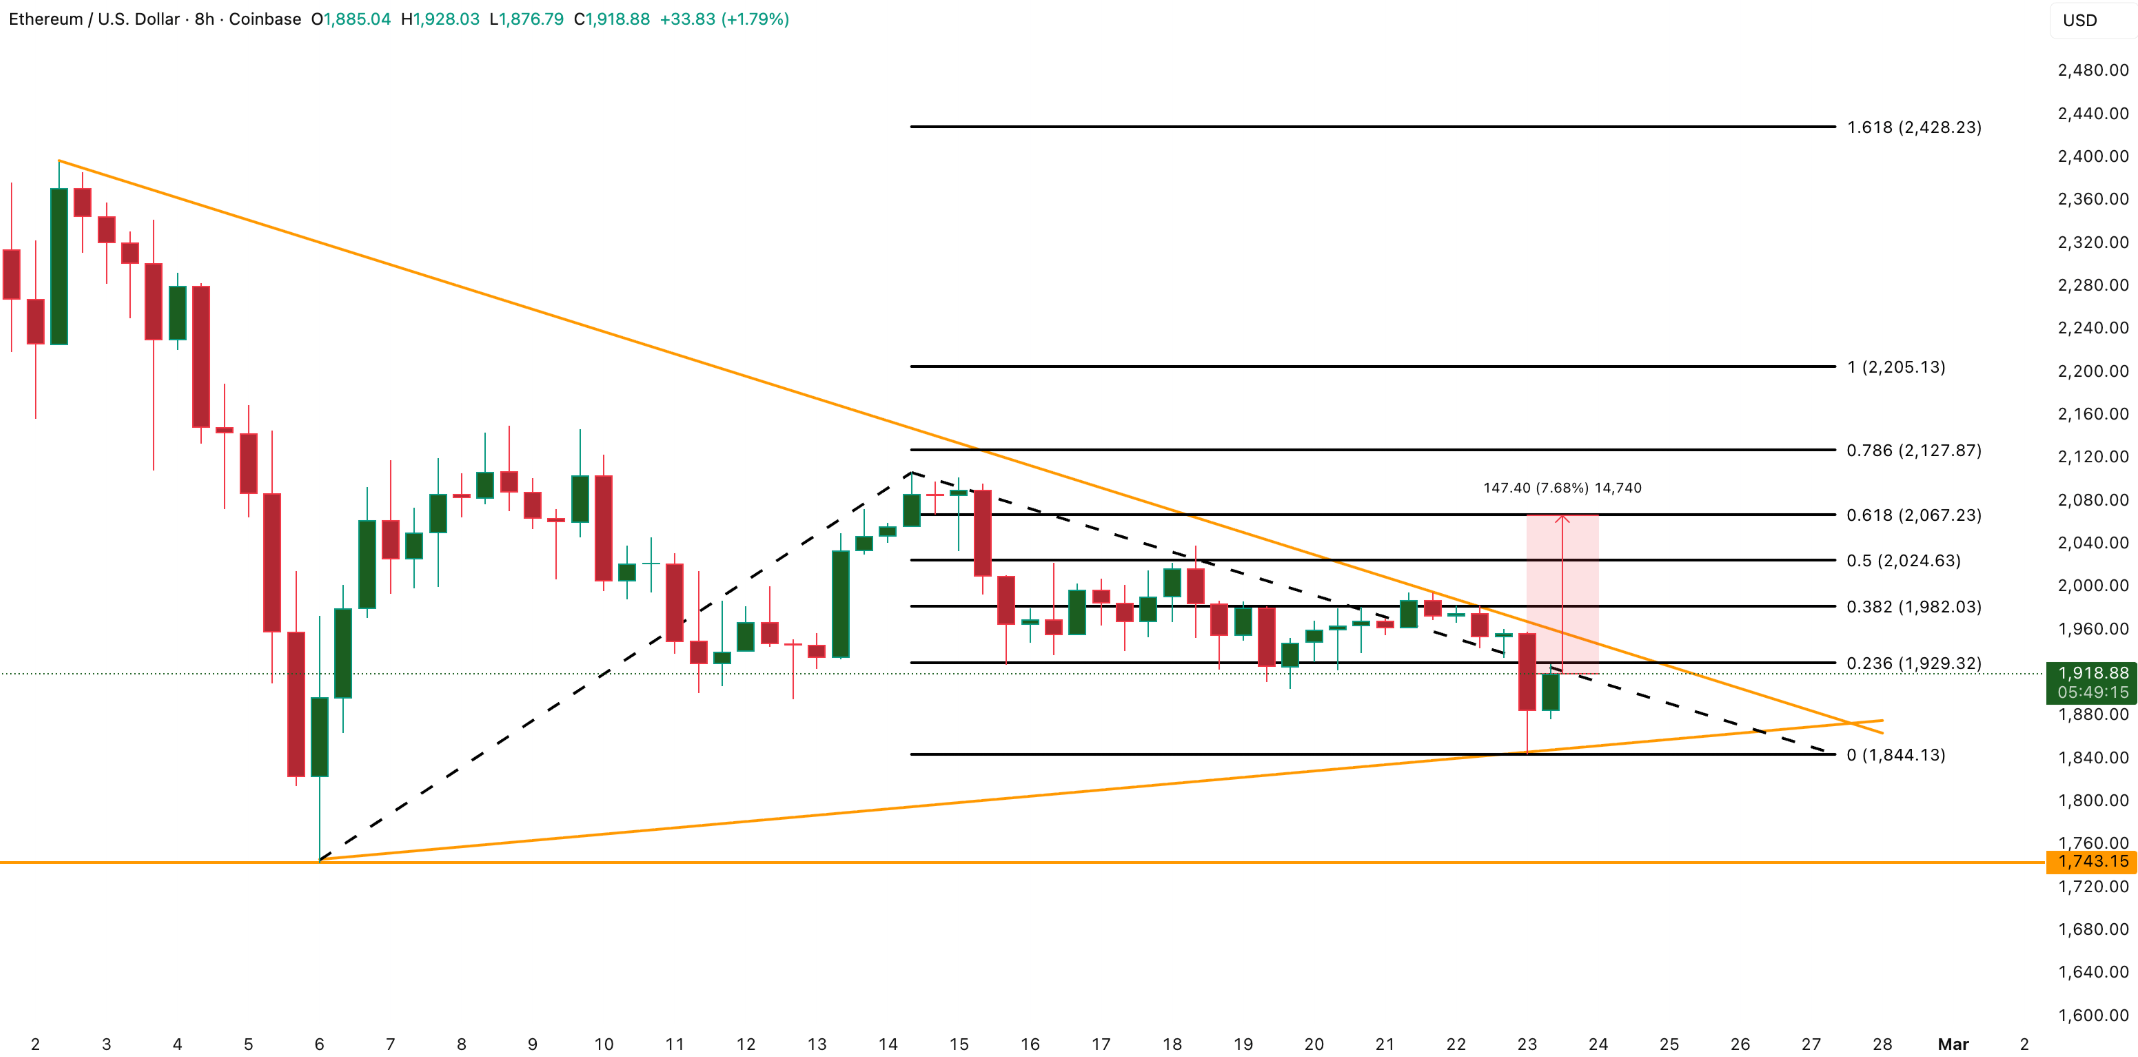
Let's look at the technical signals. On the short term charts, Ethereum has formed a symmetrical triangle, which usually points to a tug of war between buyers and sellers. But the most revealing clue is the bullish divergence in the Relative Strength Index, or RSI.
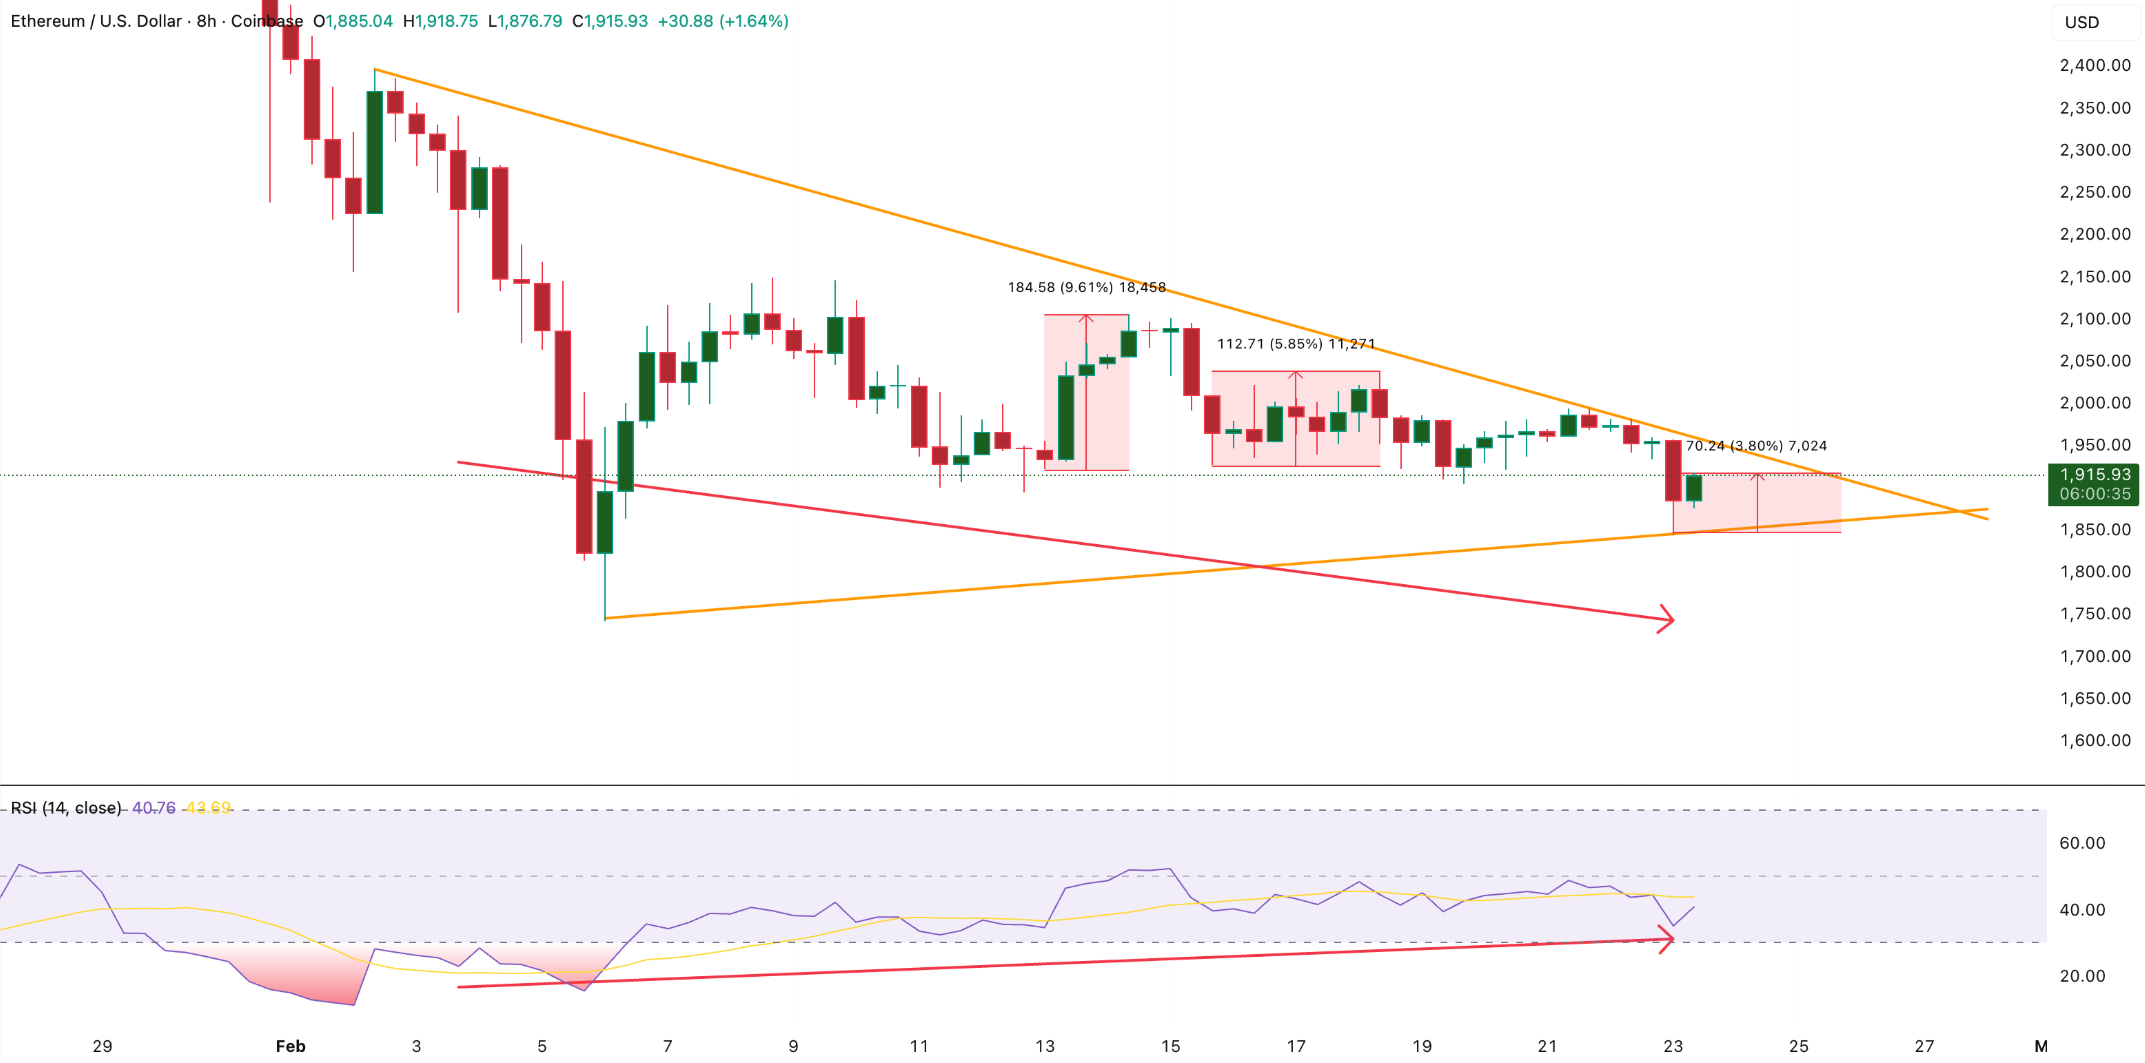
Between early February and today, February 23, the price of ETH made lower lows while the RSI momentum indicator made higher lows. This specific pattern tells us that downward momentum is exhausting itself. In fact, similar setups earlier this month triggered rebounds of 6 to 10 percent.
A Massive Drop in Exchange Inflows
Technical charts only tell half the story. The real catalyst lies in the on chain data. According to analytics firm Santiment, exchange inflows have practically vanished.
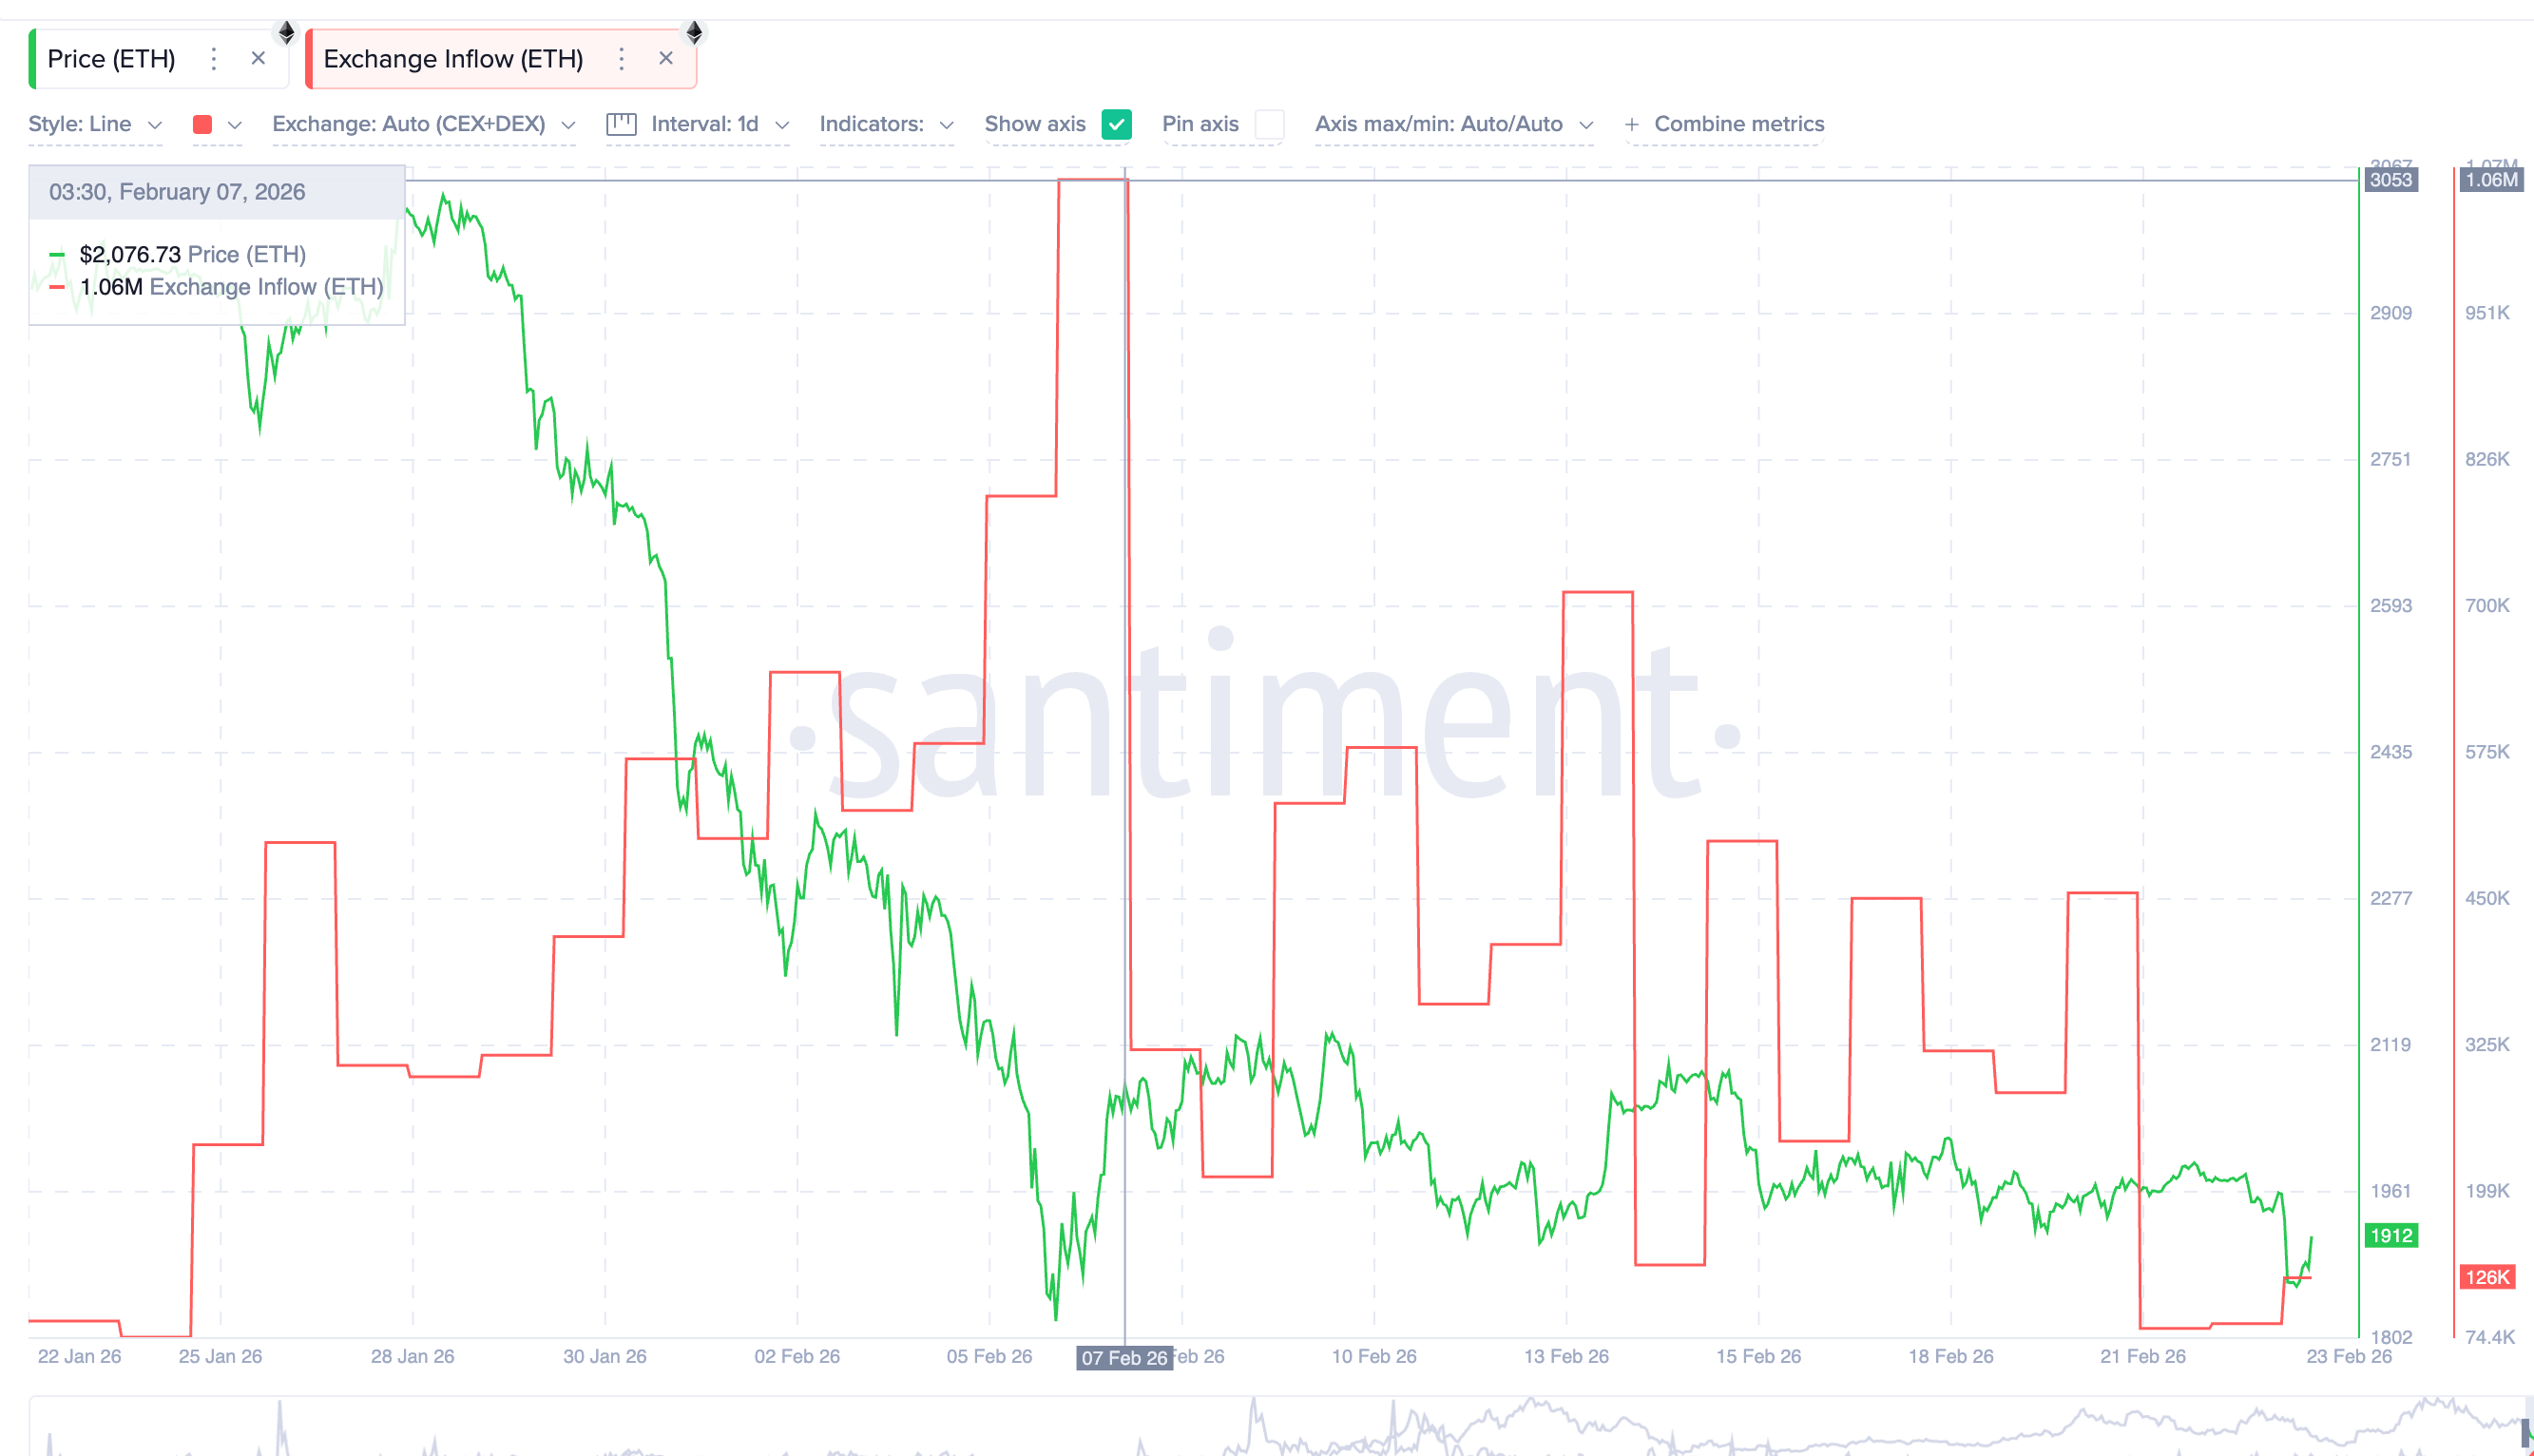
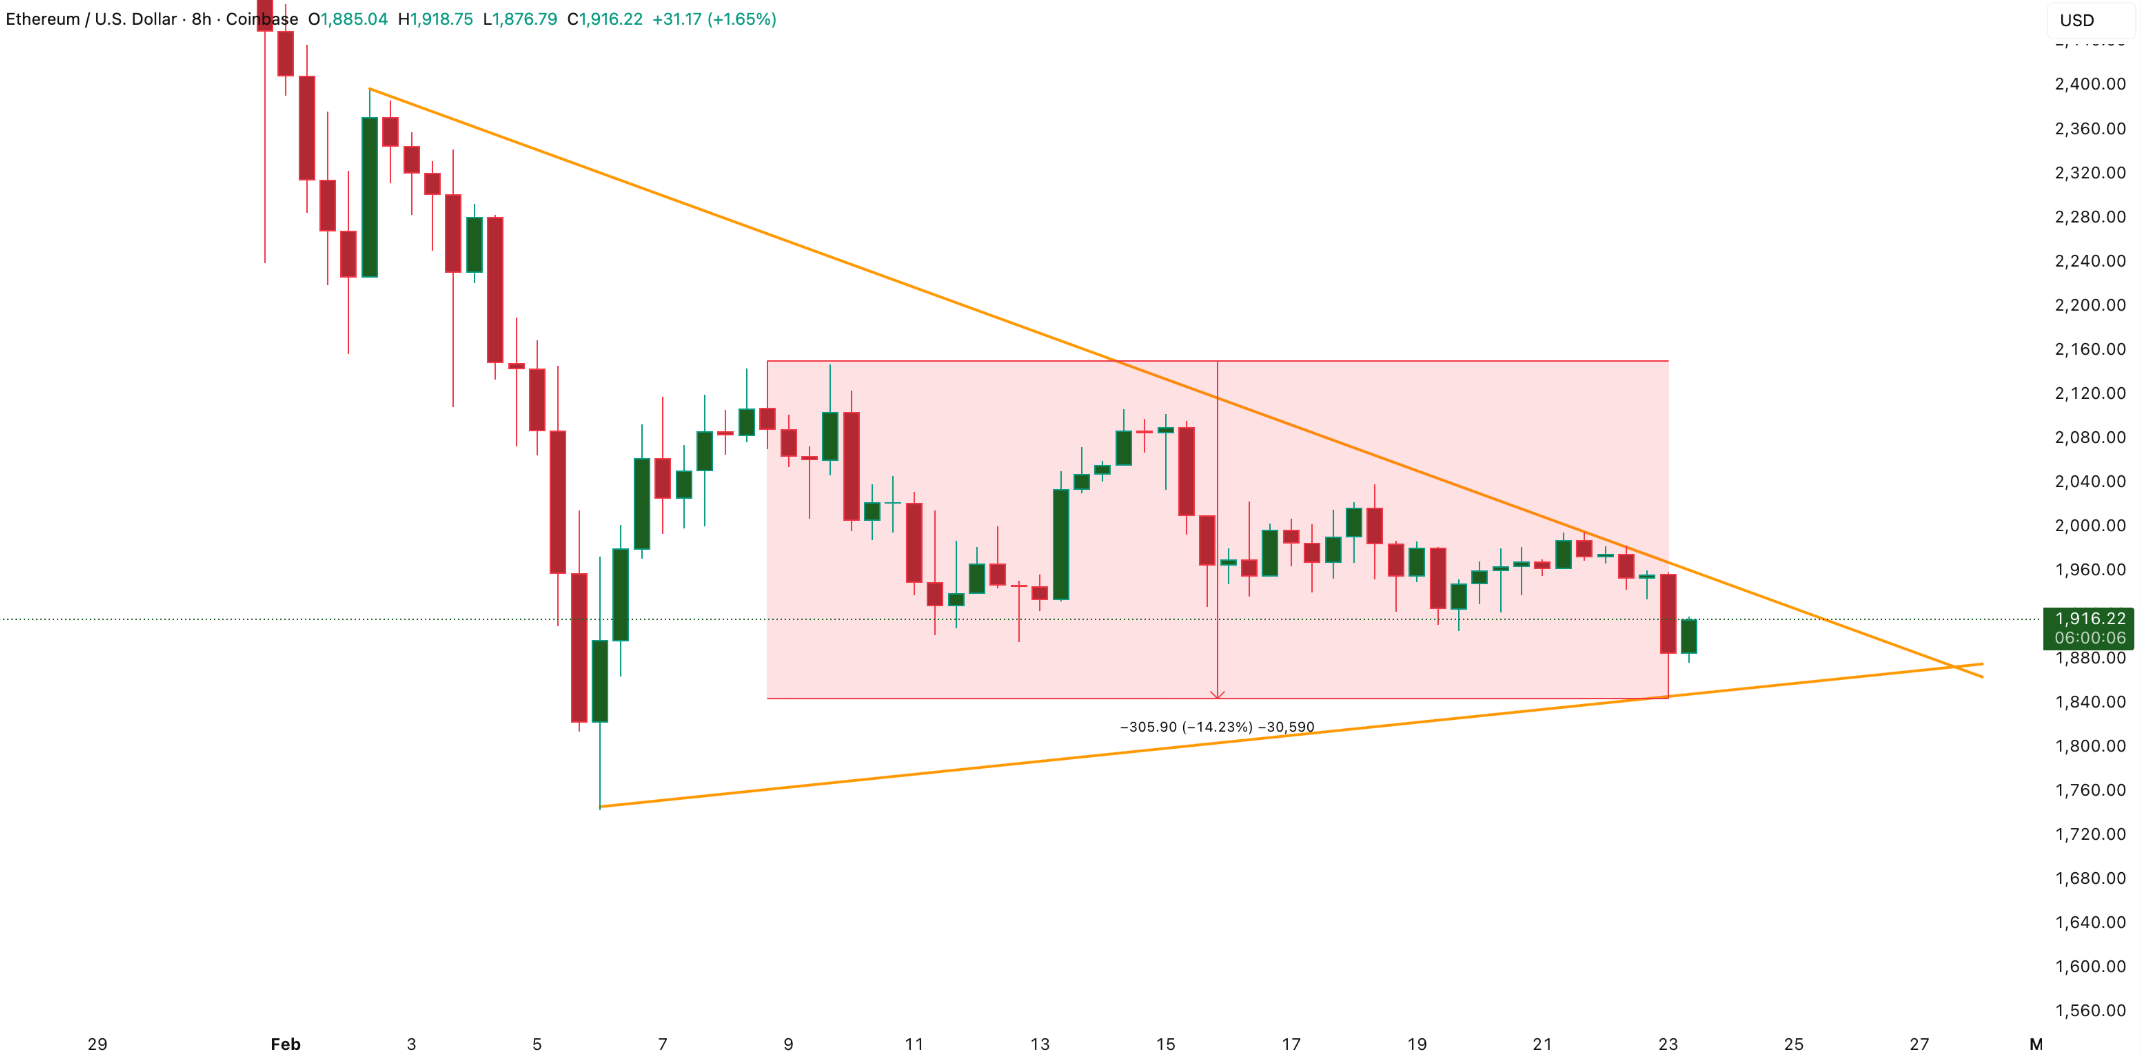
On February 7, over 1.06 million ETH moved onto exchanges, which typically signals that investors are preparing to sell. Since then, that number has plummeted to just 126,000 ETH. This represents an almost 90 percent drop in potential selling pressure. Interestingly, the price of Ethereum still fell about 14 percent during this window. When prices drop without a surge in actual spot selling, it usually means the weakness is coming from the derivatives market.
The Setup for a Short Squeeze
Derivatives traders have turned incredibly bearish, but they might be walking into a trap. Ethereum funding rates have flipped deeply negative, currently sitting around negative 0.02 percent. This means short sellers are actually paying a premium to keep their bearish bets open.
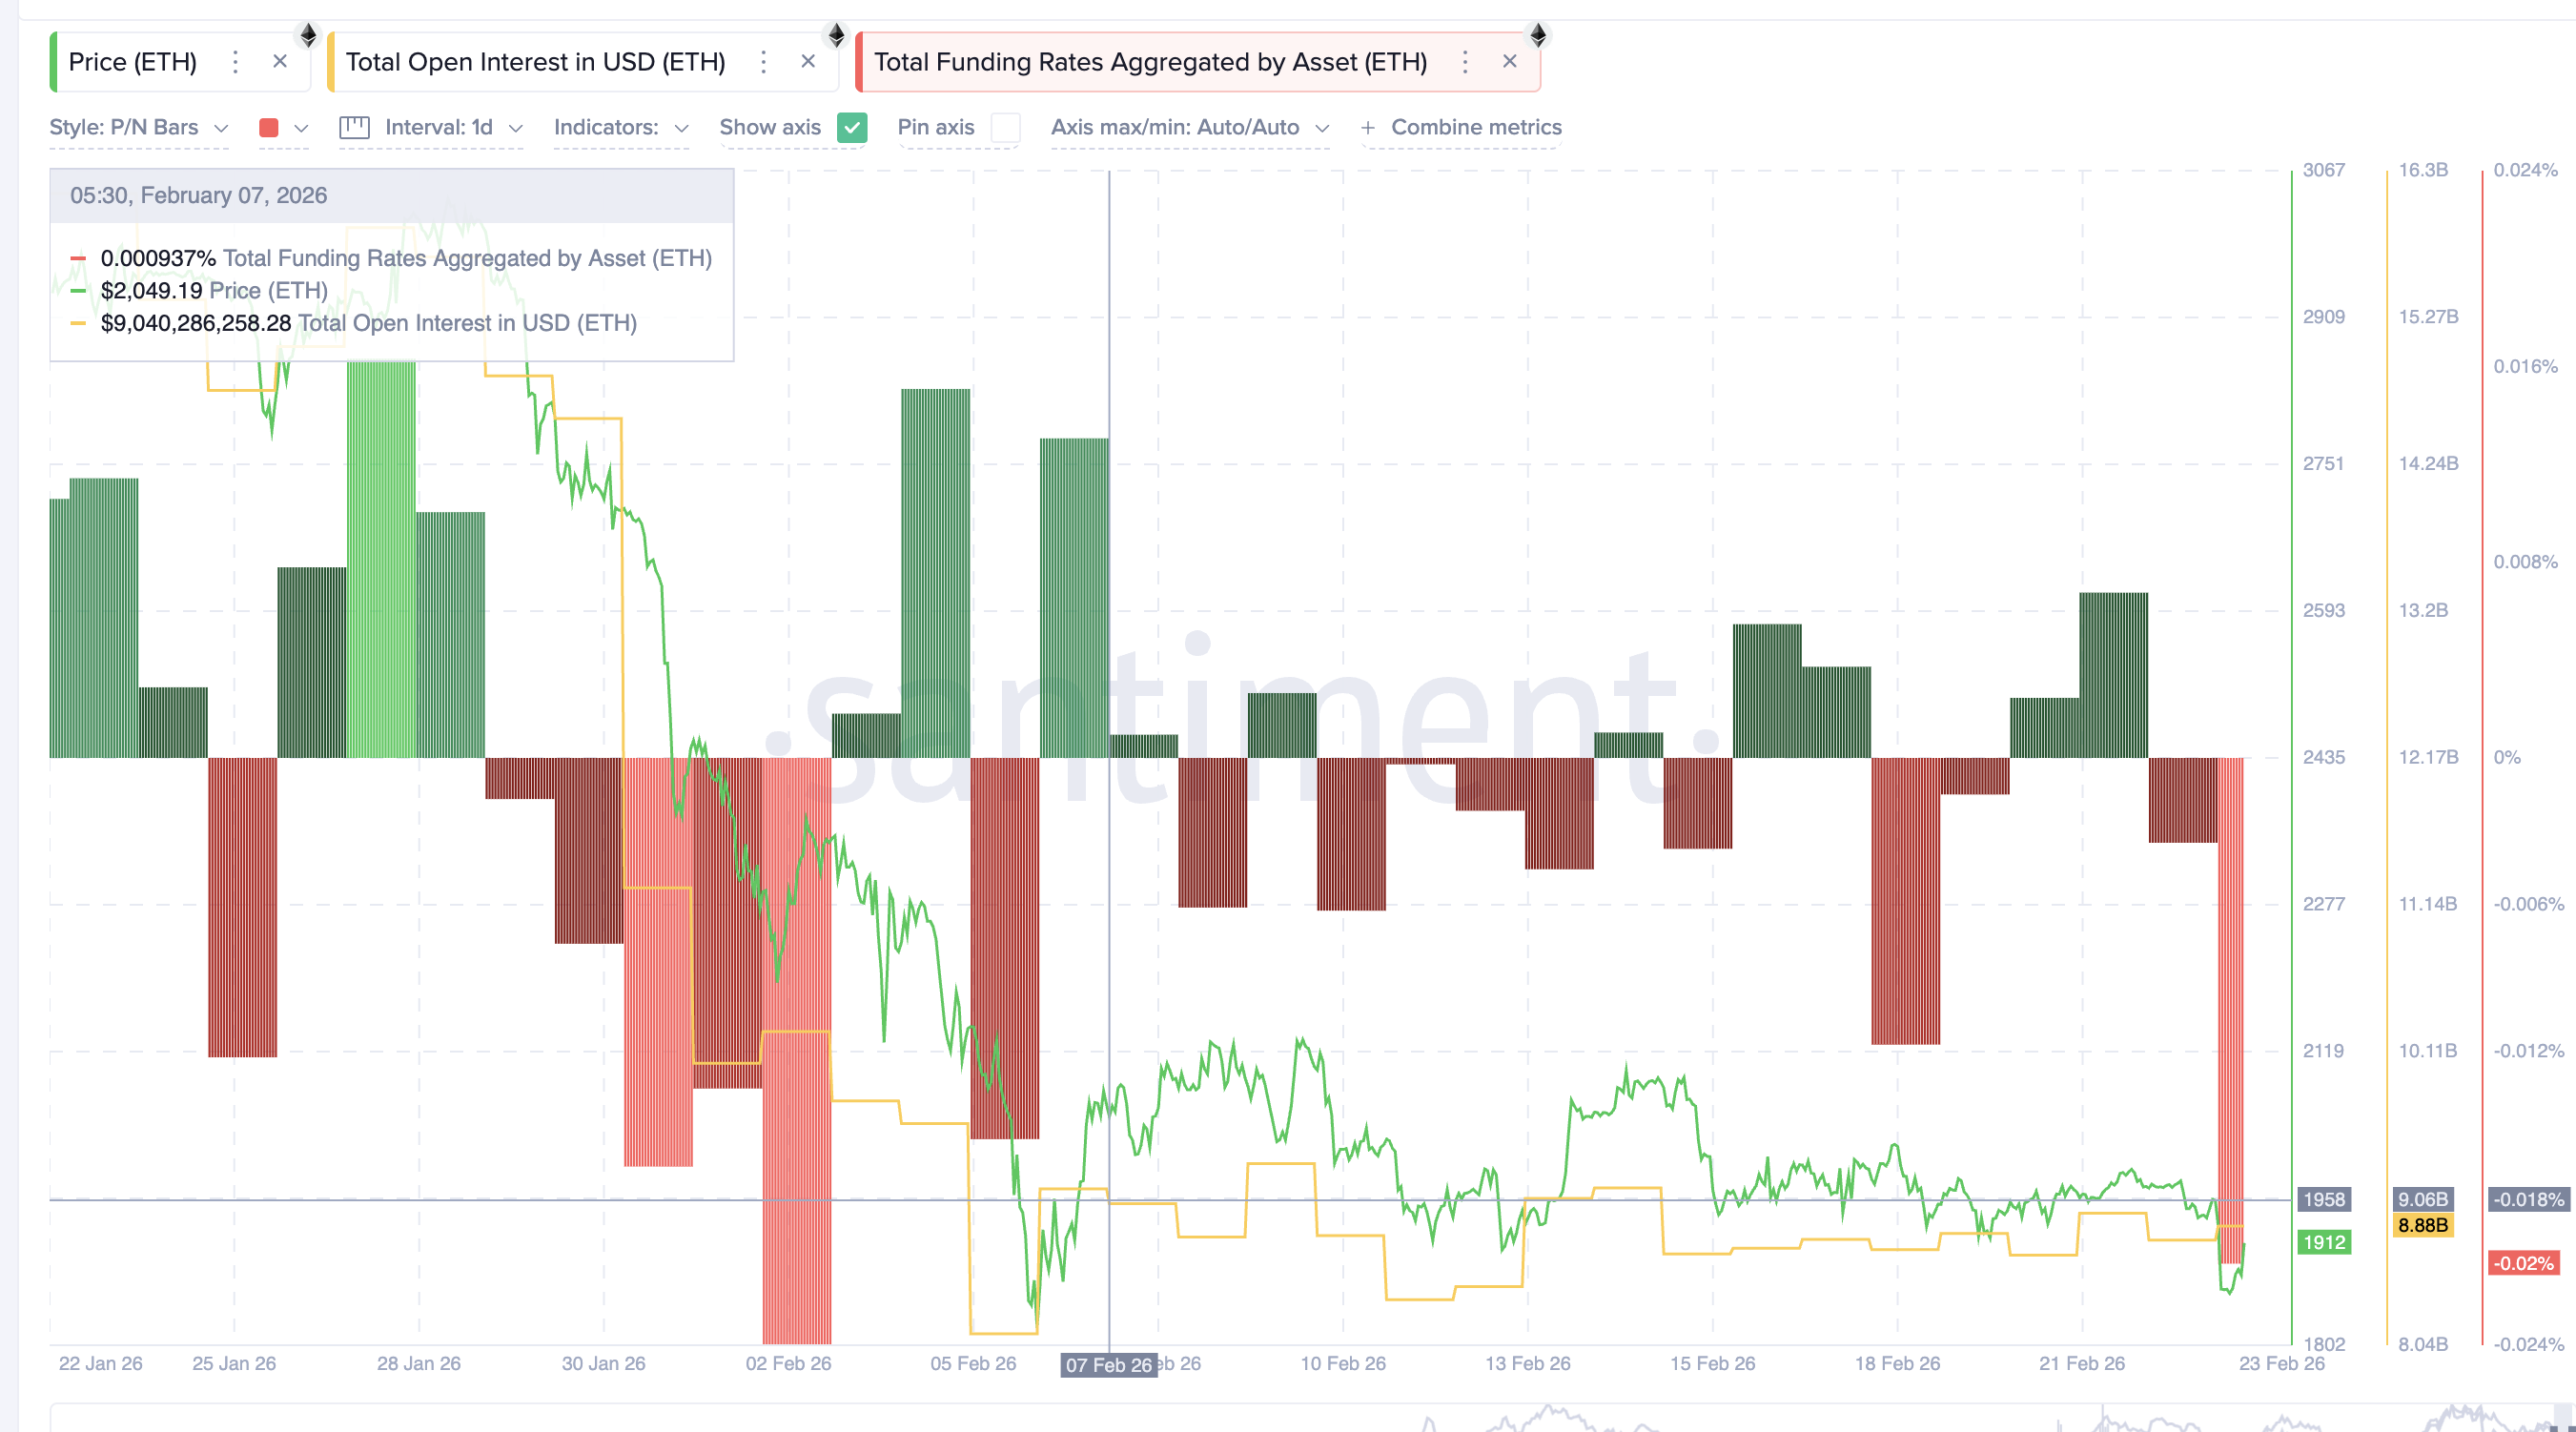
However, total open interest has barely moved, slipping only slightly from 9.06 billion USD to 8.88 billion USD. This combination is crucial. It tells us that aggressive new short sellers aren't entering the market. Instead, existing traders are simply leaning heavier into their bearish views. When the market leans too far in one direction without new money backing it up, it becomes ripe for a short squeeze. If prices continue to rise, these short sellers will be forced to buy back their positions to cut their losses, which could fuel an even faster rally.
Long Term Holders Are Buying Again
Adding fuel to the bullish fire is the return of the veterans. For weeks, experienced investors were taking profits. Data from Glassnodeshows that between February 3 and February 20, long term holders sold over 41,000 ETH.
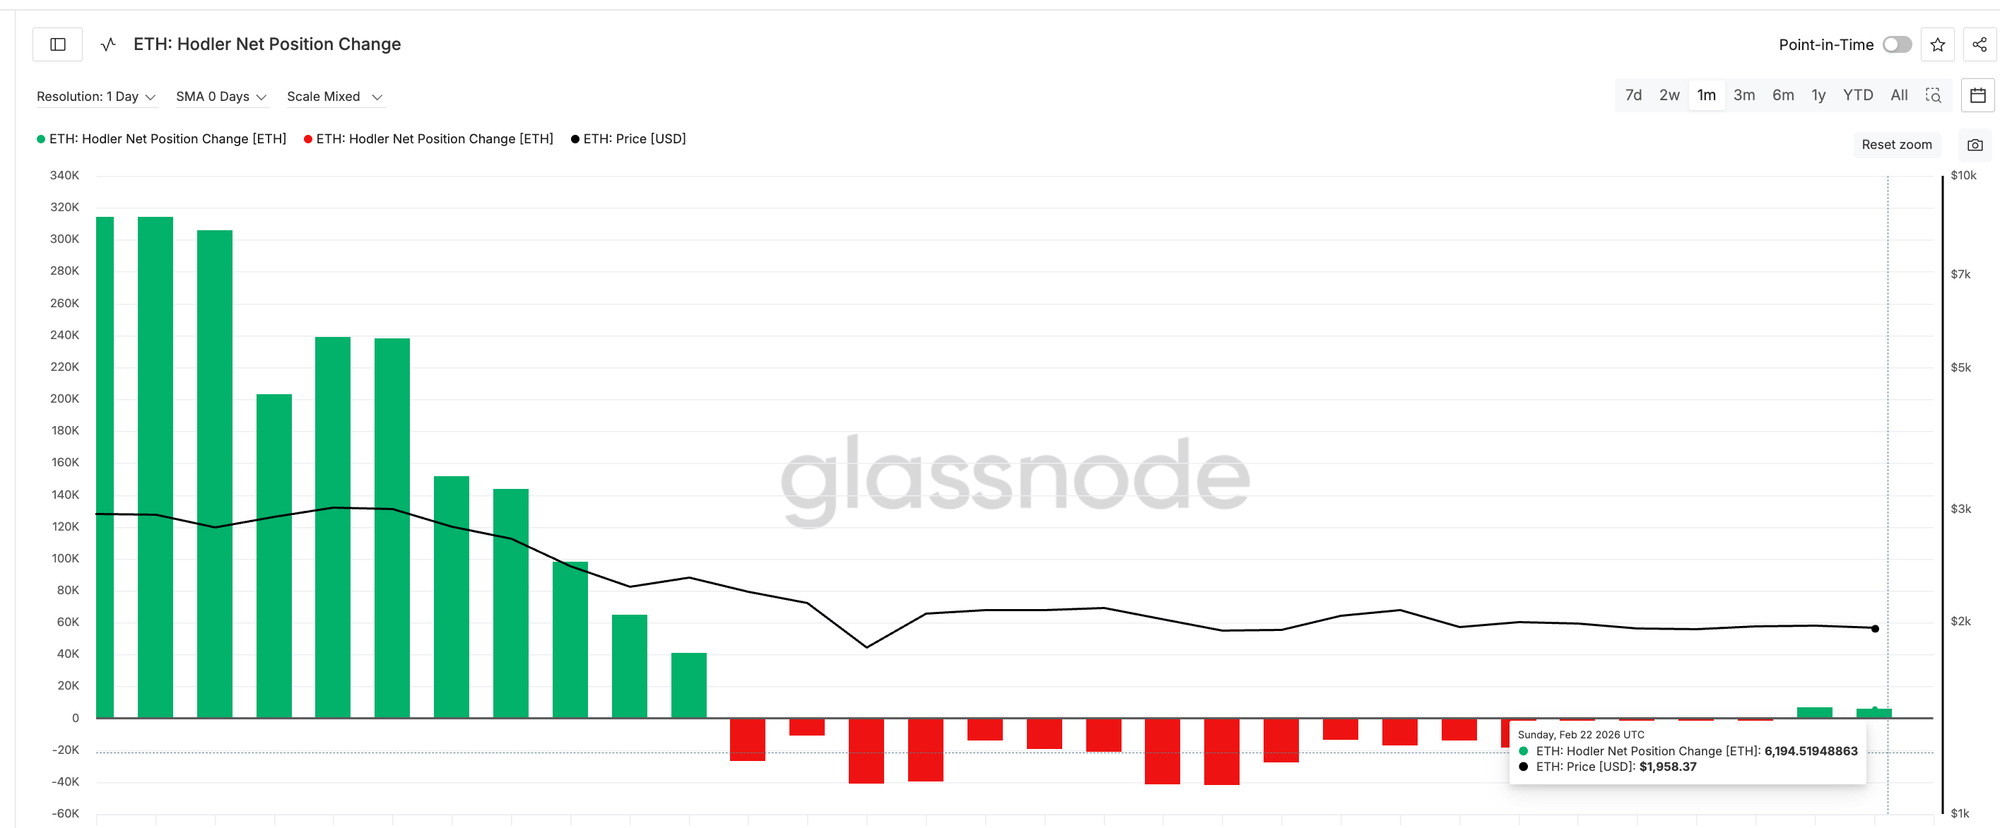
That trend just flipped. Over the last 48 hours, these same long term investors accumulated over 6,000 ETH. This type of accumulation is a classic hallmark of a local market bottom. The smart money is positioning itself before the broader retail market catches on.
Key Price Levels to Watch
So, where does Ethereum go from here? The path upward faces a few hurdles. The first major test is resistance at 1,920 USD. If ETH can break past that, the next targets are 2,020 USD and the critical barrier at 2,060 USD. Clearing 2,060 USD could accelerate this bounce into a full rally, opening the door to 2,200 USD or even 2,420 USD.
On the flip side, holding the current ground is vital. The absolute line in the sand is the 1,840 USD support level. If the price falls below that point, the bullish structure breaks down, and we could see a drop toward 1,740 USD.
Right now, this looks like more than just a temporary relief bounce. With selling pressure collapsing, derivatives leaning too far bearish, and veteran buyers returning, the stage is set for a decisive move.


