
Markets don’t move randomly — at least, that’s what Ralph Nelson Elliott believed back in the 1930s. His groundbreaking Elliott Wave Theory suggested that financial markets move in recognizable, repeating patterns driven by human psychology — cycles of optimism and pessimism that shape every bull run and correction.
Today, nearly a century later, traders across traditional finance and crypto markets still use Elliott’s insights to analyze trends and forecast price movements.
This article breaks down the theory in plain English — what it is, how it works, and why it remains both powerful and controversial.
The Origins of Elliott Wave Theory
Ralph Nelson Elliott wasn’t a Wall Street insider. He was an accountant. But after retiring due to illness, he began studying decades of market data and noticed something others had missed: prices didn’t move chaotically — they moved in “waves.”
He published his findings in 1938 in The Wave Principle, arguing that investor behavior follows a natural rhythm of growth and correction. These patterns, he believed, reflected collective human emotion — optimism driving markets higher, fear pulling them down.
Though Elliott’s research was based on the stock market, his principles apply just as well to today’s crypto markets, where psychology often moves prices faster than fundamentals.
Understanding Elliott Wave Patterns
At the heart of the theory is a simple idea: market prices move in waves, not straight lines.
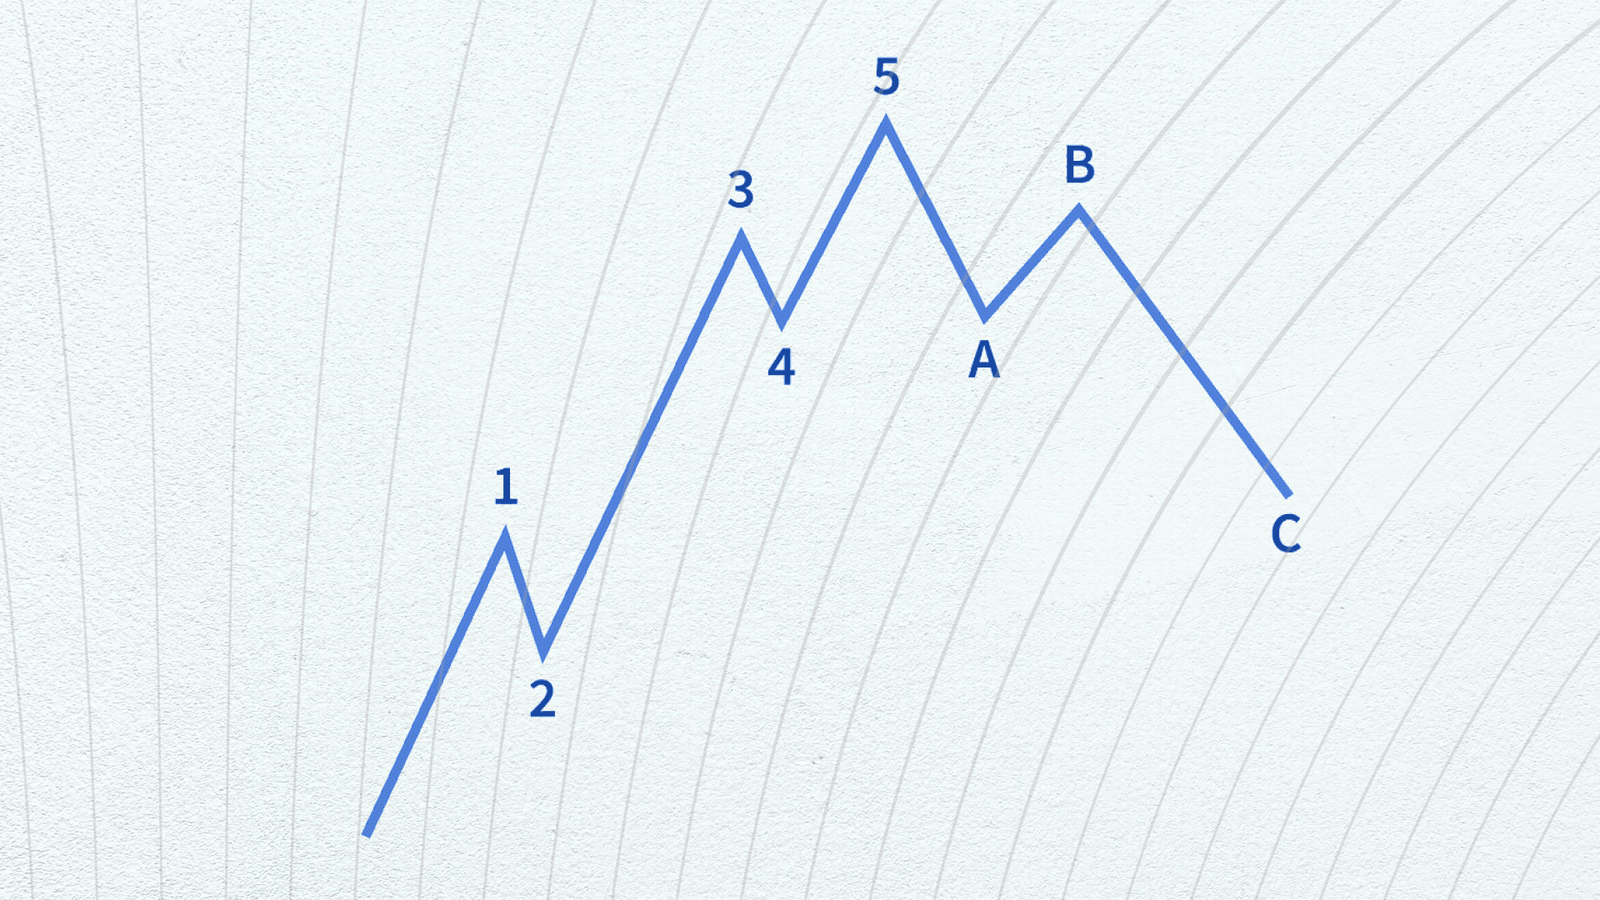
Each full Elliott Wave cycle is made up of eight distinct waves:
- Five impulse waves that move with the main trend
- Three corrective waves that move against it
This 5-3 pattern represents one complete market cycle — an advance followed by a correction.
Impulse Waves (1–5): Riding the Trend
Impulse waves move in the direction of the broader trend and typically follow predictable psychological stages:
- Wave 1: A small group of early investors spots an opportunity. The majority remain skeptical.
- Wave 2: Prices pull back as early profit-takers exit, but the retracement doesn’t erase all gains.
- Wave 3: The strongest wave — momentum builds, the crowd joins in, and optimism surges.
- Wave 4: A cooling-off phase where traders catch their breath.
- Wave 5: The final push fueled by late entrants chasing profits (often driven by FOMO, or fear of missing out).
Once Wave 5 ends, the trend is typically exhausted, and the correction begins.
Elliott’s Three Golden Rules:
- Wave 2 never retraces more than 100% of Wave 1.
- Wave 3 can’t be the shortest of the impulse waves.
- Wave 4 doesn’t overlap with Wave 1’s price range.
Corrective Waves (A–C): The Pullback
After the five-wave advance comes a three-wave correction:
- Wave A: Early profit-taking causes prices to drop.
- Wave B: A short-lived rebound gives traders false hope that the trend will continue.
- Wave C: The final selloff, often sharper than expected, completes the correction.
Elliott Waves and Fibonacci Ratios
Elliott noticed that waves often align with Fibonacci ratios — the same mathematical relationships found in nature and art.
These ratios help traders estimate where waves might begin or end:
- Wave 2 often retraces 38.2%–61.8% of Wave 1.
- Wave 3 is typically 1.618× the length of Wave 1.
- Wave 4 tends to retrace about 38.2% of Wave 3.
- Wave C is often equal in length to Wave A.
Traders use Fibonacci retracements and extensions to set price targets, identify support and resistance, and anticipate where momentum might shift.
The Limitations of Elliott Wave Theory
Elliott Wave analysis is as much an art as it is a science. While the framework is structured, its interpretation is highly subjective — two analysts can look at the same chart and count completely different waves.
Other limitations include:
- Real-time application is tough. Wave structures often evolve unexpectedly.
- Retrospective bias. It’s easier to label waves after they’ve formed.
- No guaranteed accuracy. The theory helps forecast probabilities, not certainties.
Because of these challenges, seasoned traders usually combine Elliott Wave analysis with other tools — such as volume, momentum indicators, or macroeconomic trends — for confirmation.
Why It Still Matters
Despite its critics, Elliott Wave Theory has stood the test of time. It captures something fundamental about markets: they’re driven by people, not just numbers.
Whether in stocks or crypto, price charts mirror human emotion — fear, greed, hope, and despair — repeating across decades and technologies. Elliott’s framework remains one of the most elegant ways to visualize that cycle.
Key Takeaways
- Invented by: Ralph Nelson Elliott in the 1930s
- Core idea: Prices move in recurring 5-wave and 3-wave patterns
- Driven by: Investor psychology and crowd behavior
- Often paired with: Fibonacci ratios for forecasting price targets
- Main drawback: Highly subjective interpretation


