

The crypto king, Bitcoin (BTC), is facing a nervous start to November, trading around $104,268 as a cluster of bearish technical indicators signals a high risk of a significant short-term correction.
Traders are warily watching for a major breakdown that could erase recent gains and send the price below the critical $100,000 psychological support level, potentially initiating a deeper sell-off.
Technical Threat: The Head and Shoulders Pattern
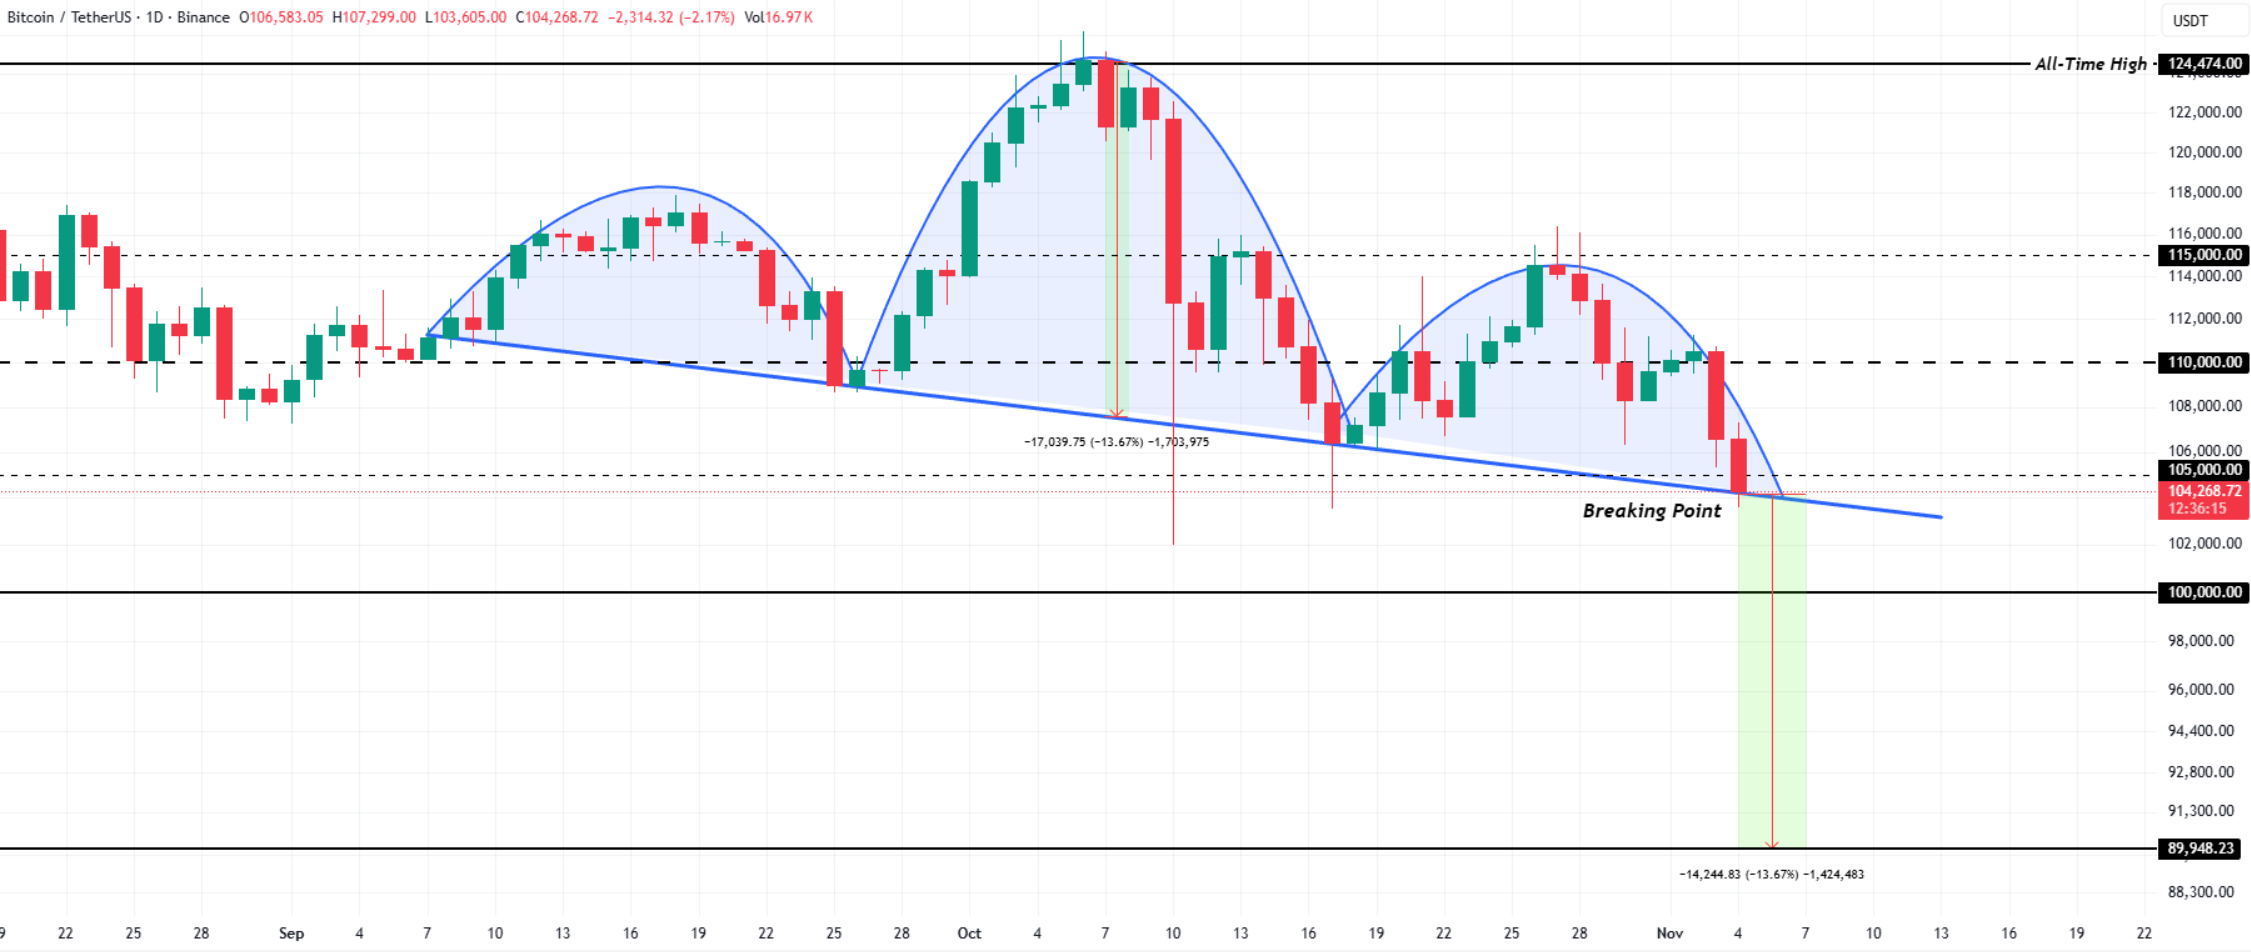
The most immediate danger comes from a looming Head and Shoulders (H&S) pattern visible on the charts. This classical technical formation is a well-known signal for a potential trend reversal and a bearish breakdown.
If this H&S pattern confirms by breaking its neckline (the support line connecting the low points), the analysis suggests Bitcoin could face a targeted 13.6% drop. This would see the price spiral down to roughly $89,948, confirming that the current weakness is more than just a momentary dip.
Money is Exiting: 16-Month Low for CMF
The selling pressure is validated by a harsh reading from the Chaikin Money Flow (CMF) indicator, which measures the volume-backed flow of capital in and out of the asset.
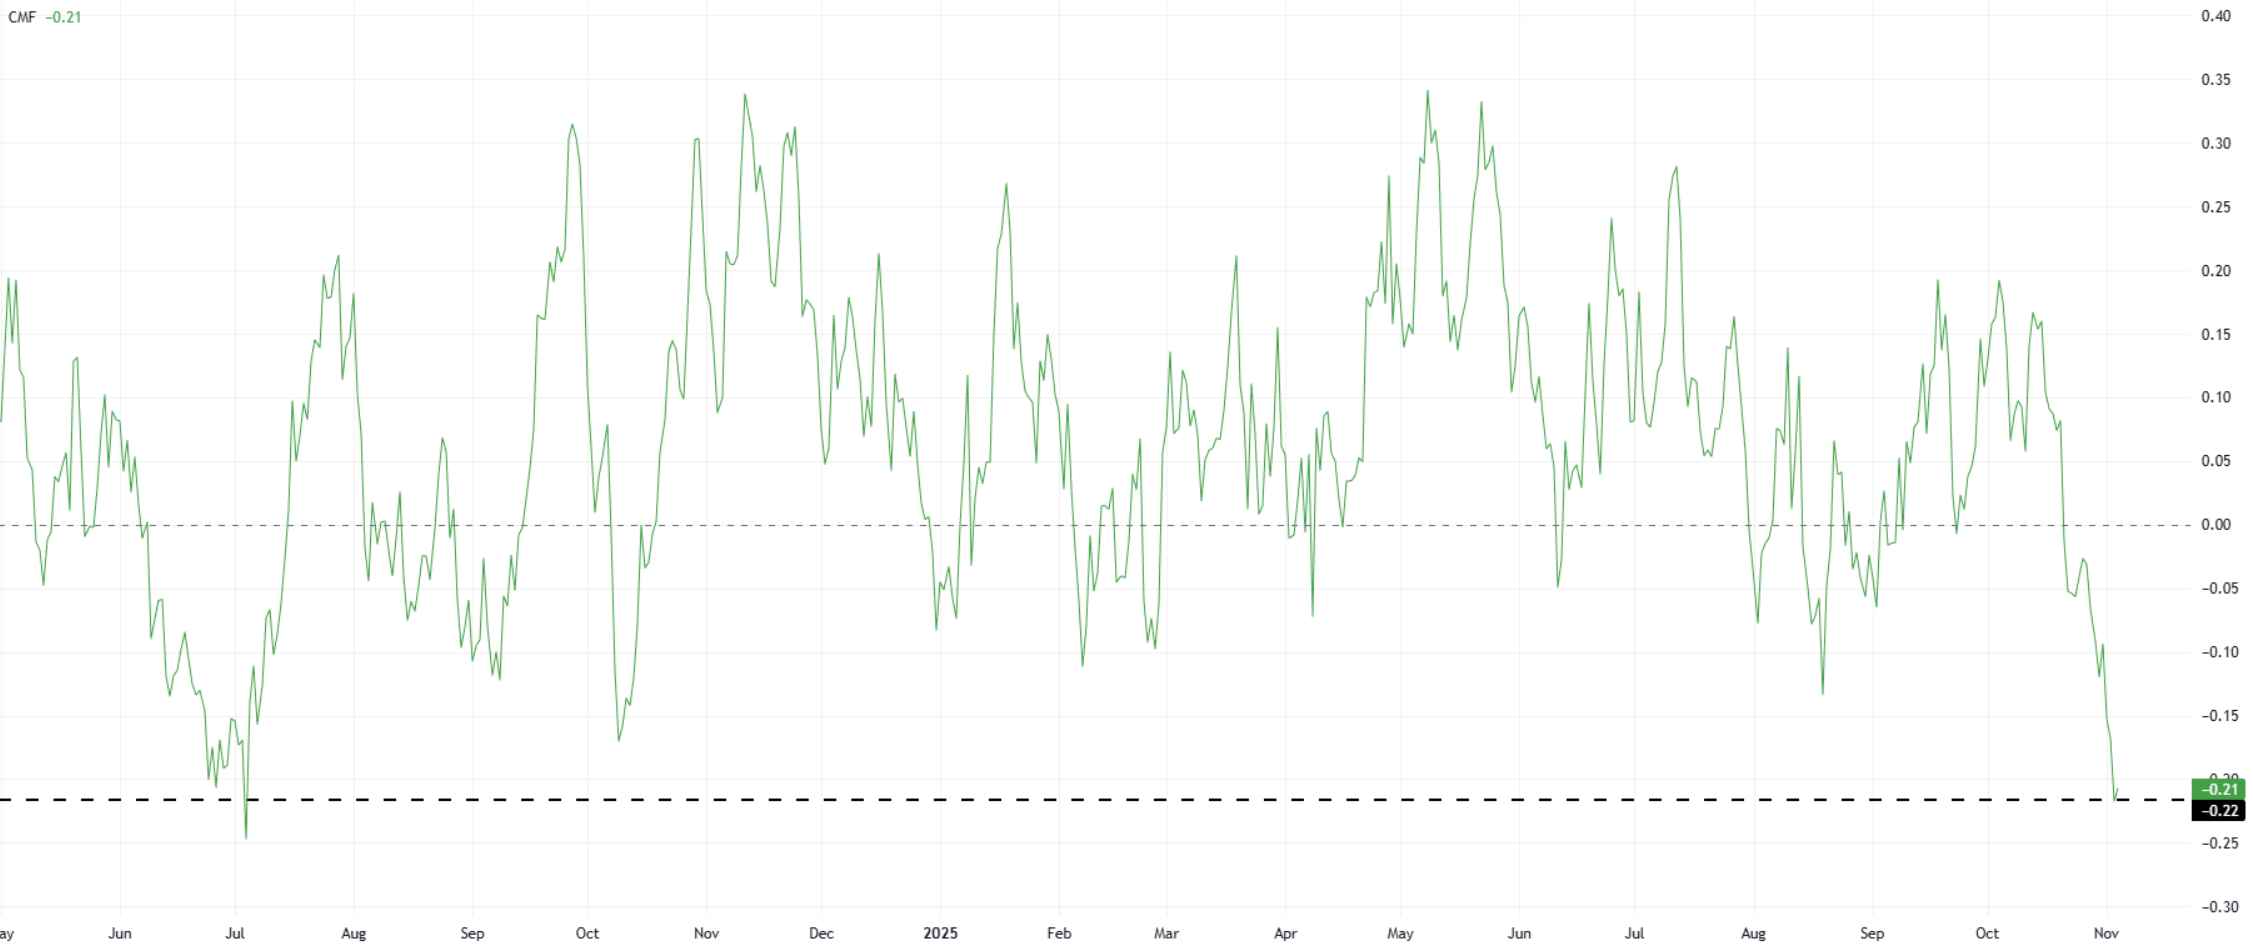
The CMF has plummeted to its lowest level in 16 months, confirming that outflows are currently dominating Bitcoin trading across major exchanges. Such sustained negative money flow is a classic precursor to deeper price corrections, as institutional and large-scale investors de-risk and reduce their exposure.
Looming Threat: The Death Cross Shadow
Adding to the technical anxiety is the growing risk of a Death Cross formation among Bitcoin's Exponential Moving Averages (EMAs).
A Death Cross occurs when a short-term moving average crosses decisively below a long-term moving average, generally signaling the start of a sustained downtrend. While Bitcoin has narrowly managed to avoid this bearish crossover four times in the last two years, each near-miss was followed by significant price corrections, averaging 21% to 23% declines.
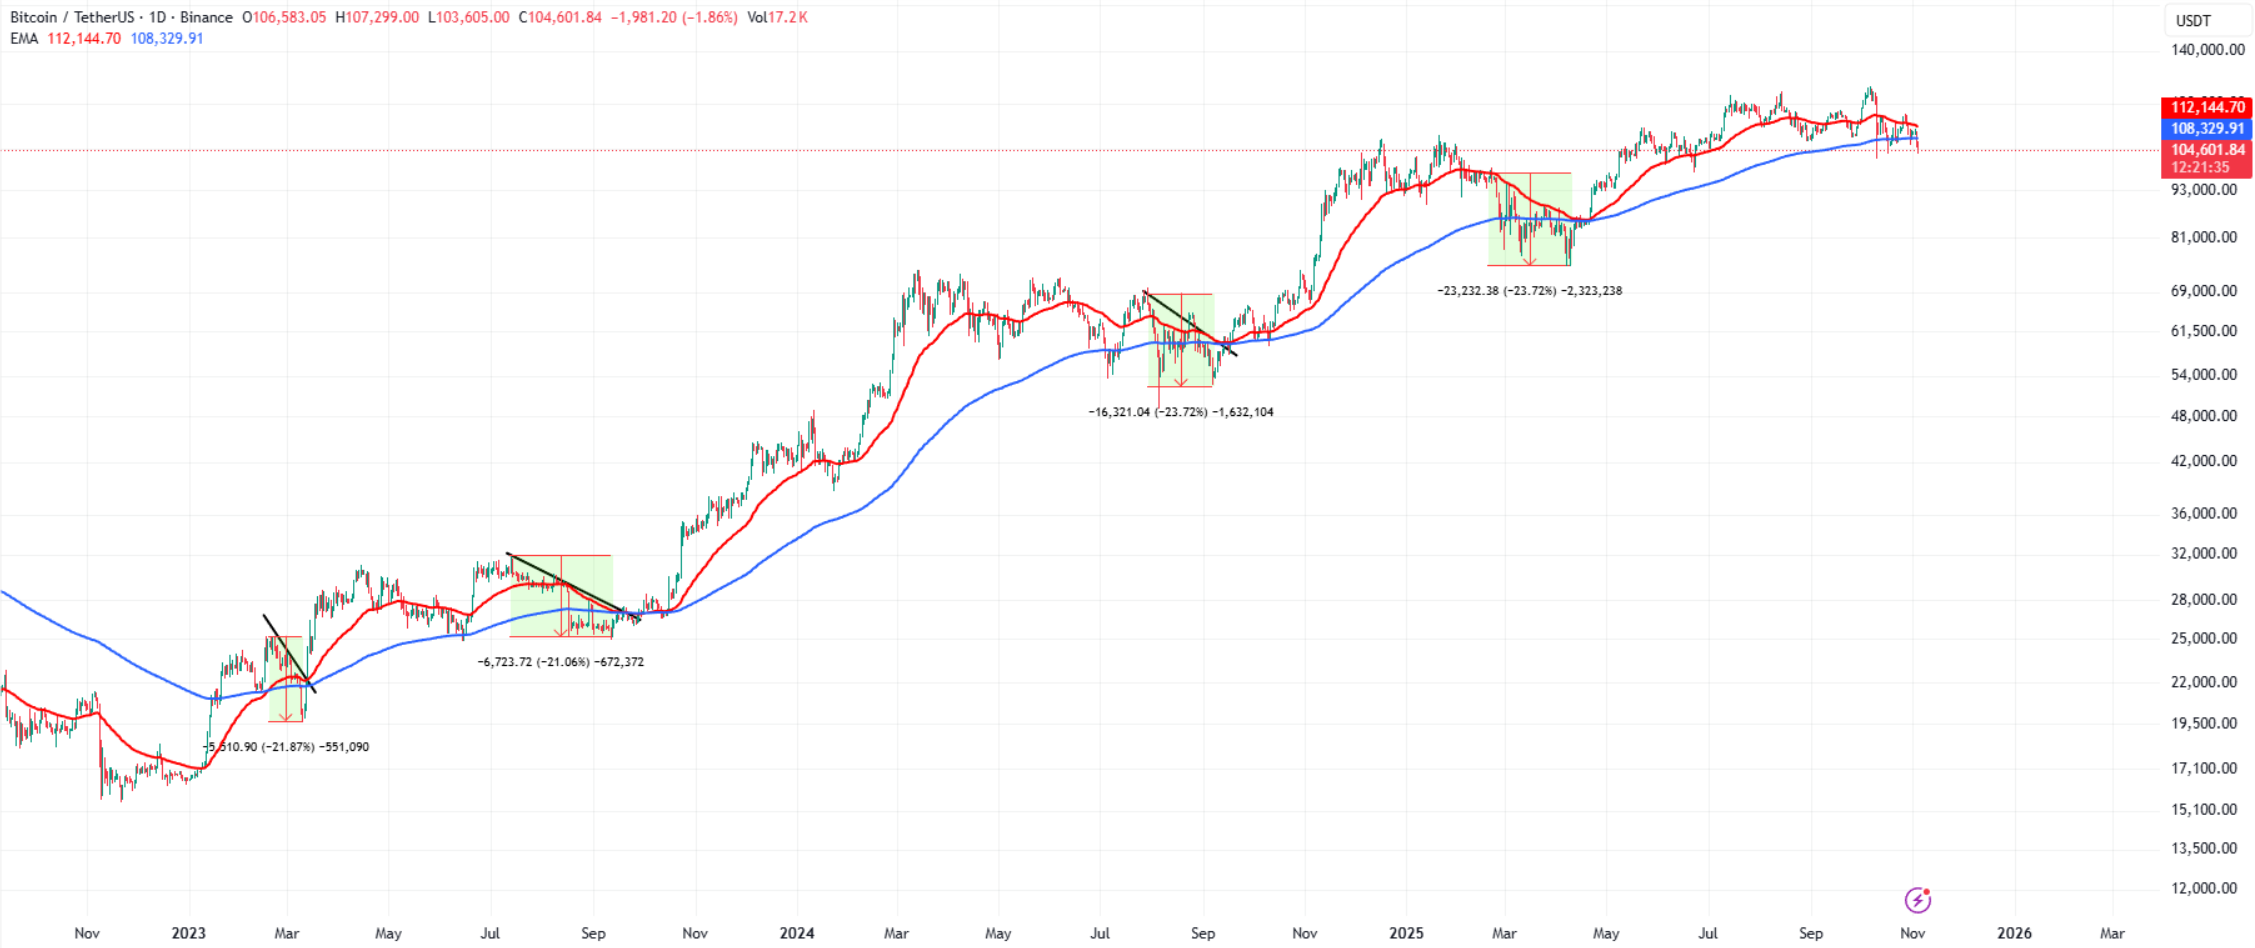
If this pattern confirms and BTC retraces by that magnitude from current levels, the price could easily fall well below $100,000, compounding the risk from the H&S pattern and volume exhaustion.
Key Price Levels to Watch Right Now
The market is currently engaged in a high-stakes battle around the $105,000 level, which has recently flipped from support to resistance.
- Bearish Scenario (The Crash): If BTC fails to reclaim $105,000 and breaks below the neckline of the H&S pattern, the immediate risk is a test of the crucial $100,000 psychological support. A decisive failure here opens the path to the $89,948 target.
- Bullish Scenario (The Rebound): For the bearish outlook to be invalidated, Bitcoin must find strong buying support, reclaim $105,000 as a stable floor, and push toward the next major resistance at $110,000. Sustaining price action above this level would restore confidence and invalidate the immediate crash warnings.
For the short-term, the overwhelming technical signals—the H&S setup, strong capital outflows, and the looming Death Cross—suggest that downside risk remains highly elevated. Traders should proceed with extreme caution.


