

Bitcoin could face further downside in the months ahead, with prices potentially sliding toward the $60,000 range, according to new analysis from onchain data firm CryptoQuant. The company says current market conditions appear more fragile than the early stages of the 2022 bear market, pointing to weakening demand, tightening liquidity, and increasingly bearish technical signals.
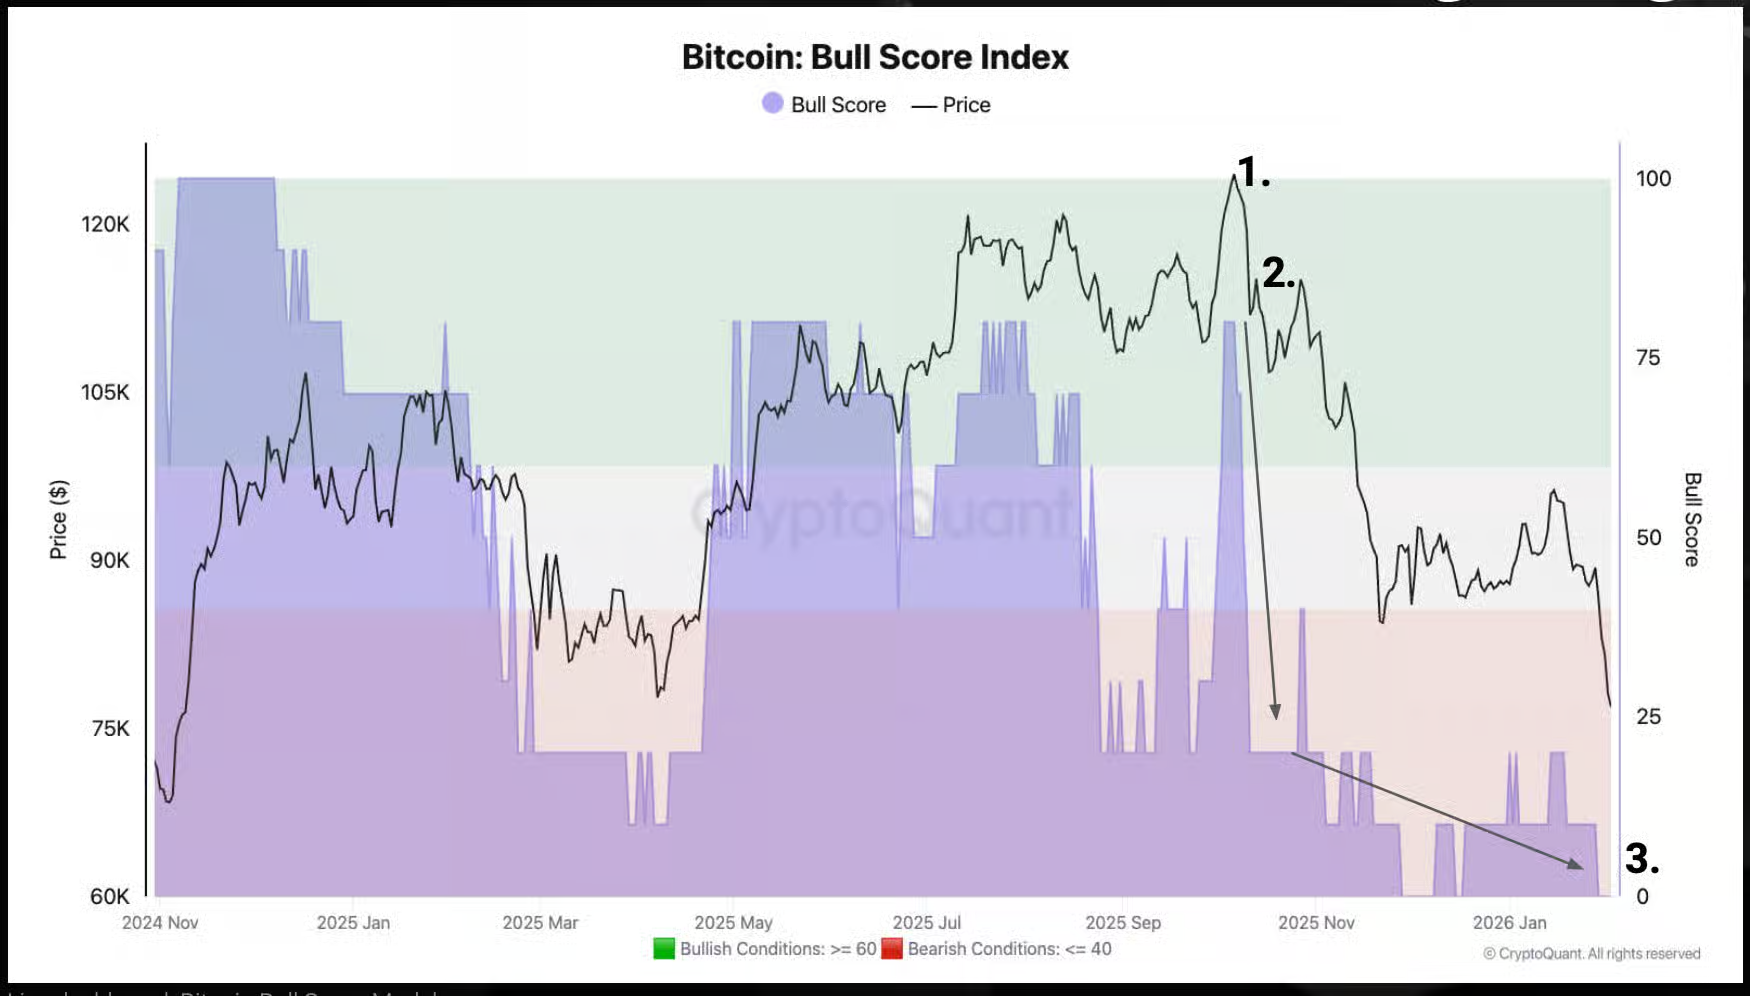
In a report released Wednesday, CryptoQuant said its Bull Score Index has fallen to zero, the lowest and most bearish reading possible. The index stood at 80 in early October, when bitcoin reached a peak near $126,000. Sentiment shifted sharply after a major liquidation event on October 10, and the index has continued to deteriorate as prices moved lower.
CryptoQuant now identifies the next significant support zone between $70,000 and $60,000. According to Julio Moreno, the firm’s head of research, a move toward the lower end of that range could take several months. He noted that the $60,000–$70,000 band includes historically important levels, such as the previous cycle’s all-time high near $69,000 and bitcoin’s estimated production cost, currently between $65,000 and $70,000.
Bitcoin was trading around $67,350 on Thursday, continuing a steady decline seen over recent weeks.
Structural Weakness Across the Crypto Market
Beyond price action, CryptoQuant highlighted what it described as “broad structural weakness” across the crypto market. One of the most significant shifts has been a reversal in institutional demand. At this time last year, U.S. spot bitcoin exchange-traded funds were net buyers of more than 46,000 BTC. In 2026, those same products have become net sellers, reducing holdings by approximately 10,600 BTC.
That change represents a demand gap of roughly 56,000 BTC compared with 2025 and has added to ongoing selling pressure, according to the firm. Retail participation in the U.S. has also remained muted. The Coinbase premium, which measures bitcoin prices on Coinbase relative to global exchanges, has stayed negative since mid-October. Historically, sustained bull markets have coincided with a positive premium driven by strong U.S. demand, a pattern that is currently absent.
Liquidity conditions are also tightening. CryptoQuant noted that the 60-day growth in Tether’s USDT market capitalization has turned negative by $133 million, marking the first contraction since October 2023. Stablecoin supply growth peaked at $15.9 billion in late October 2025, and its reversal is consistent with liquidity pullbacks typically seen during bear market phases.
Longer-term demand trends paint a similar picture. Over the past four months, bitcoin’s annual spot demand growth has fallen sharply, dropping from 1.1 million BTC to just 77,000 BTC, a decline of 93%. According to CryptoQuant, this suggests that most of the demand generated during the current cycle may already be behind the market.
Bearish Technical Signals Add Pressure
Technical indicators are reinforcing the cautious outlook. Bitcoin has slipped below its 365-day moving average for the first time since March 2022, a move often associated with a sustained downtrend. Since breaking below that level on November 12, 2025, the price has fallen 23% over 83 days.
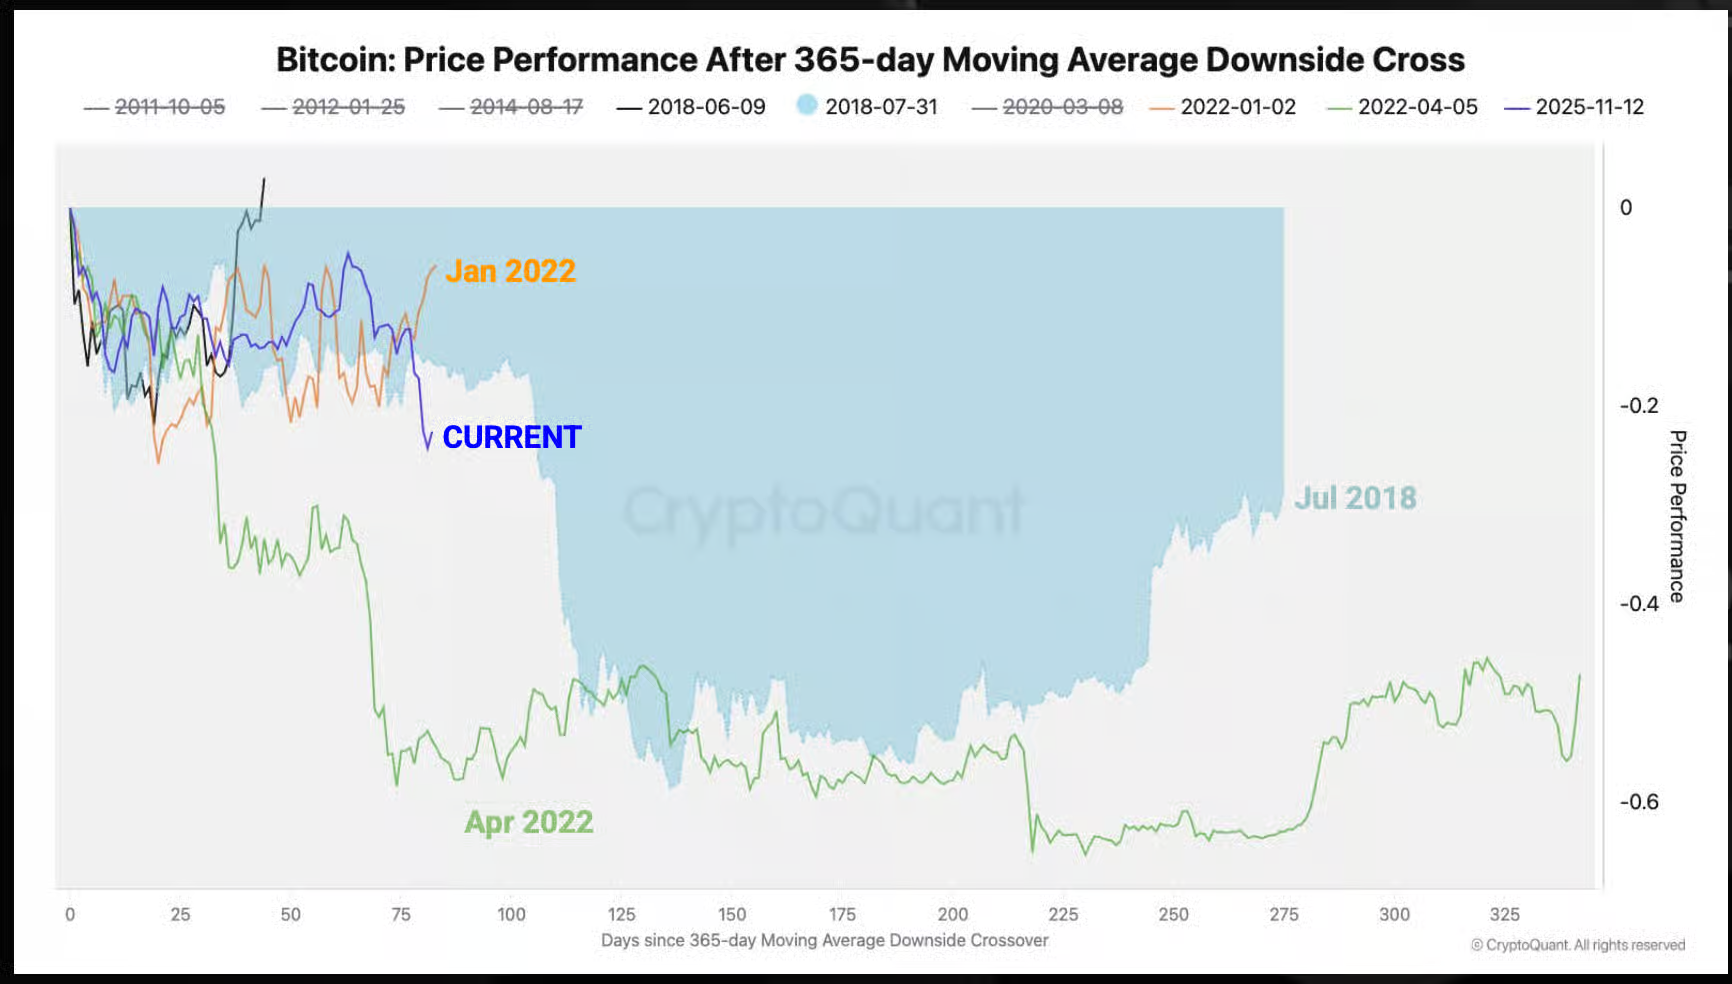
CryptoQuant noted that this performance is weaker than at the start of the previous bear market. In January 2022, bitcoin had declined only 6% over a comparable 83-day period.


