

As the calendar turns to 2026, the Bitcoin market feels like a coiled spring. We are standing at a crossroads where extreme fear meets ambitious price targets. On one side, optimists like Tom Lee are still calling for a surge toward 200,000 USD. On the other, veteran traders like Peter Brandt warn that we might need to test lower depths before any real recovery begins.
According to Tom Lee:
— Clockwise Crypto (@clockwisecrypto) December 27, 2025
Ethereum could reach $7k–$9k in early 2026
Bitcoin could move toward $200k in 2026
Ethereum has a longer-term path toward $20k
Rather than labeling it a “supercycle,” he frames this as a fundamental shift in market structure. pic.twitter.com/uaCmAUUD4u
The confusion is understandable. The recent price action has felt like a "fake-out" to many, with voices like YoungHoon Kim arguing that these dips are temporary manipulations designed to shake out weak hands. But who is right?
To cut through the noise, we need to look beyond the headlines and dive into what the blockchain data is actually telling us.
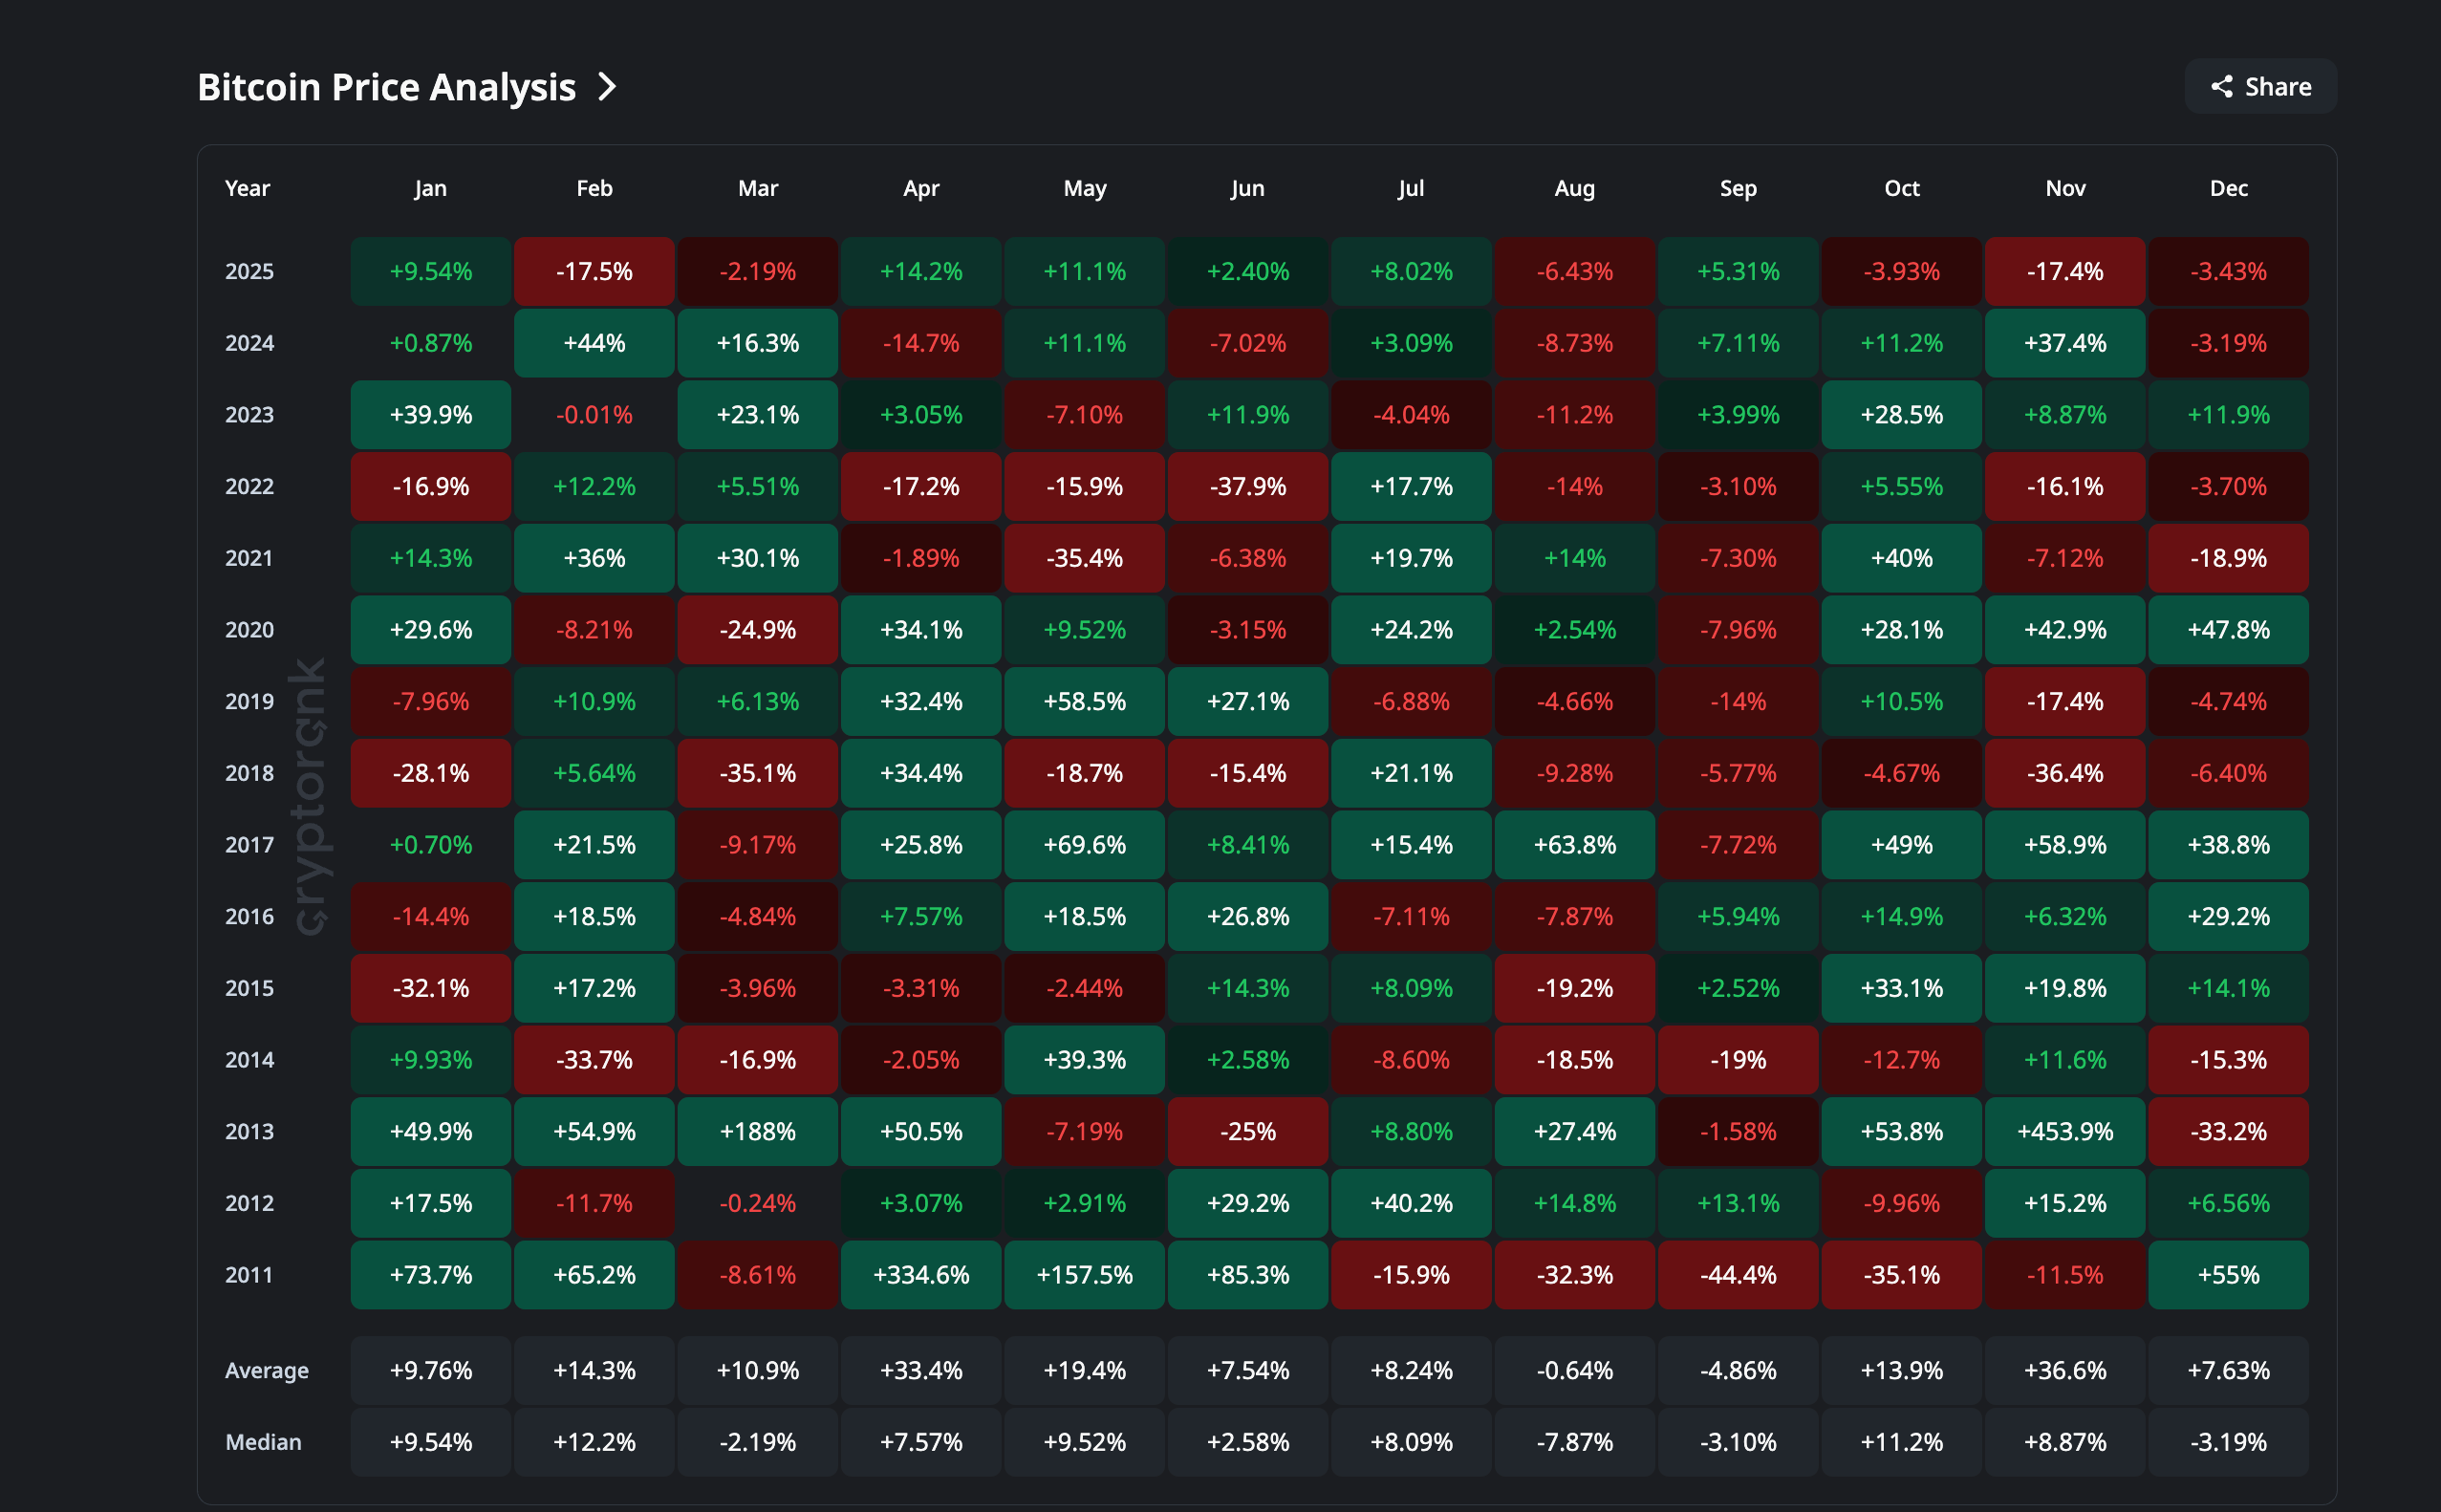
The "January Effect" and the Red December
History has a funny way of rhyming in crypto. Bitcoin is currently on track to close December in the red. While that sounds gloomy, it might actually be the silver lining traders have been waiting for.
Since 2022, a fascinating pattern has emerged: Every time Bitcoin closes December with a loss, January flips green.
This exact setup occurred right before the massive rally in April 2025, which eventually catapulted the price to its October peak of 126,000 USD. Now, as we end another bearish December, the stage is potentially set for a similar rebound in early 2026.
The Signal Flashing "Buy" (That No One Is Watching)
If you want to know when to buy, you usually look for "blood in the streets." In on-chain terms, we look at the Short-Term Holder NUPL (Net Unrealized Profit/Loss). This metric tells us if recent buyers are in profit or panic-selling at a loss.
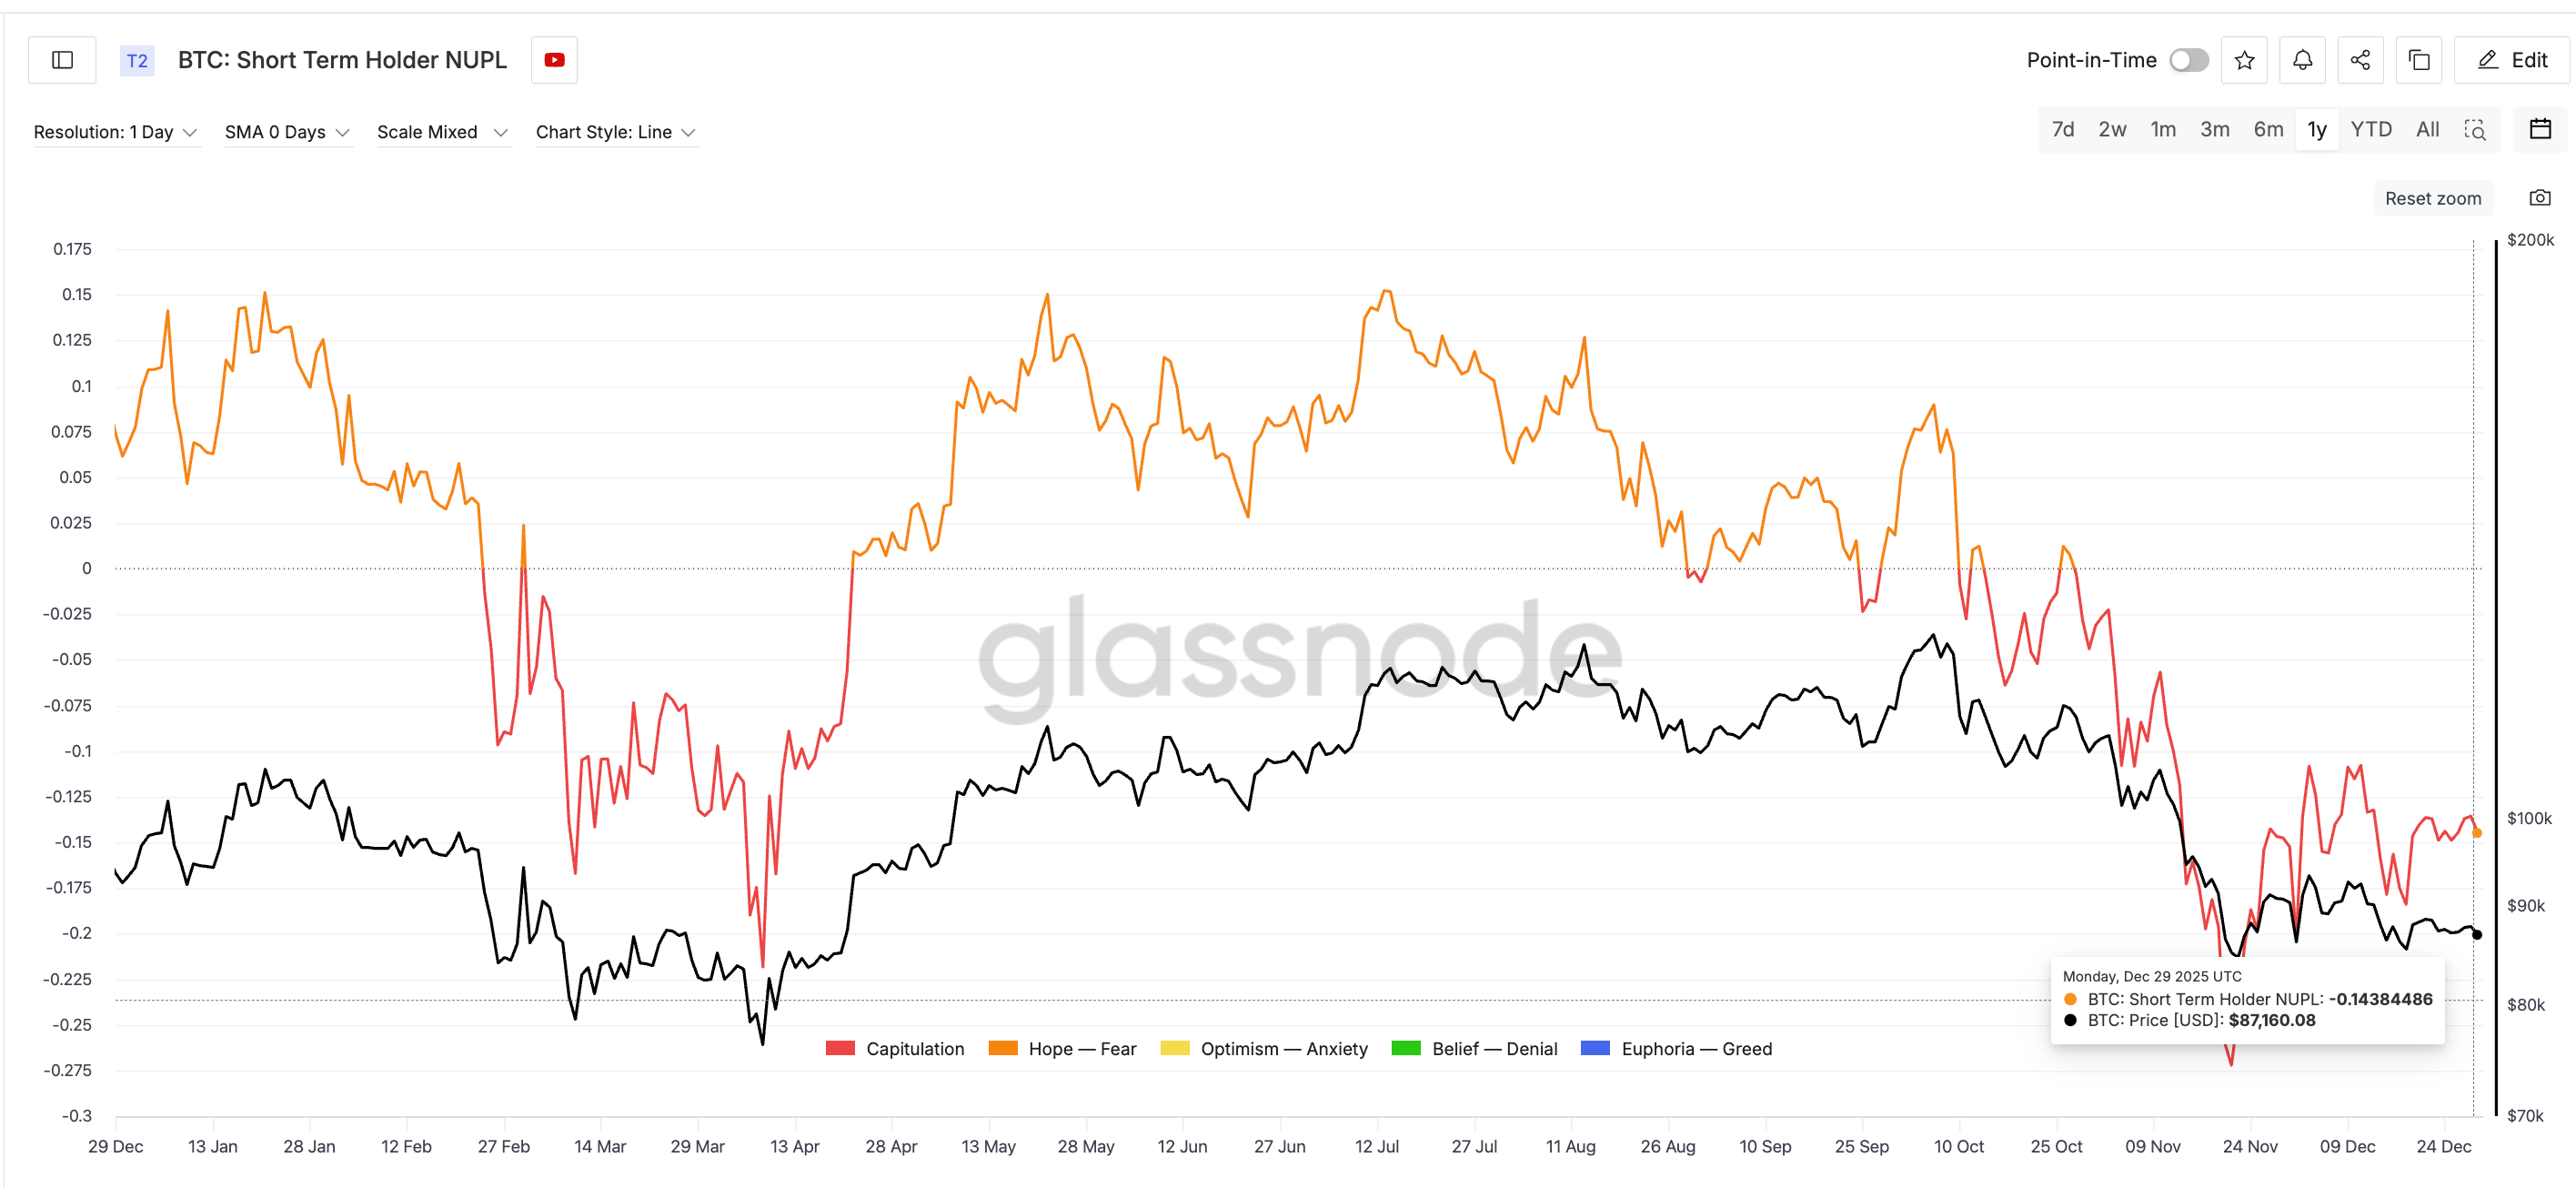
Right now, they are panic-selling.
- The Signal: On November 21, this metric dropped to -0.27. This is deep "capitulation" territory.
- The Context: The last time the signal was this low was back in April 2025-the exact bottom that launched the run to new all-time highs.
- The Problem: While the "buy signal" is technically flashing, the market hasn't reacted yet. Why?
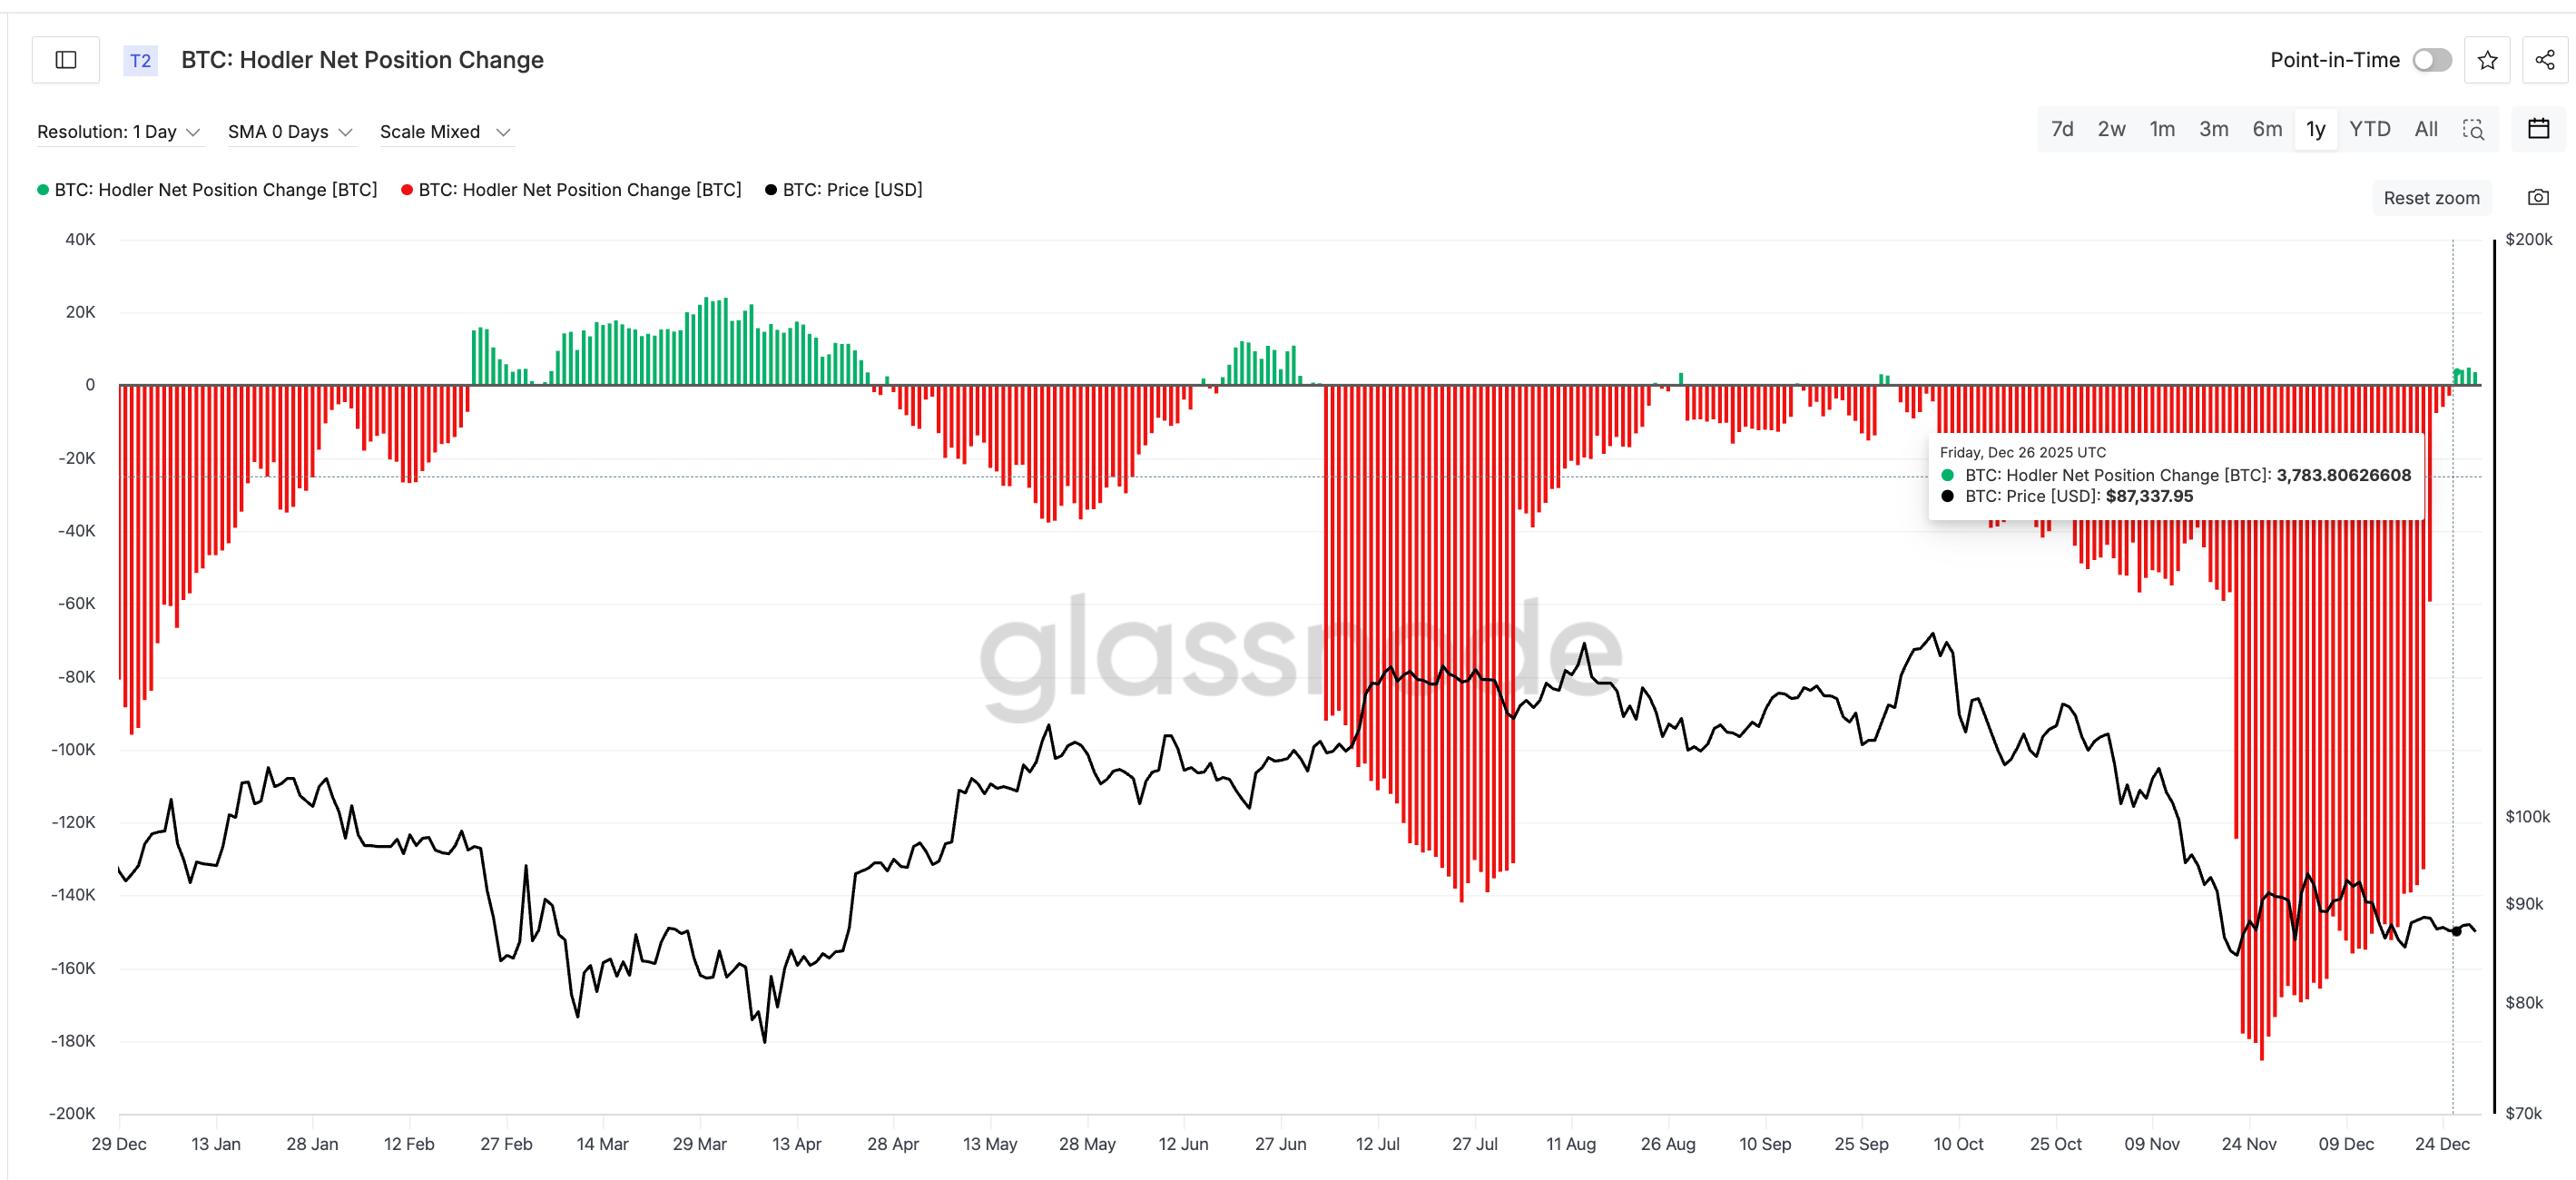
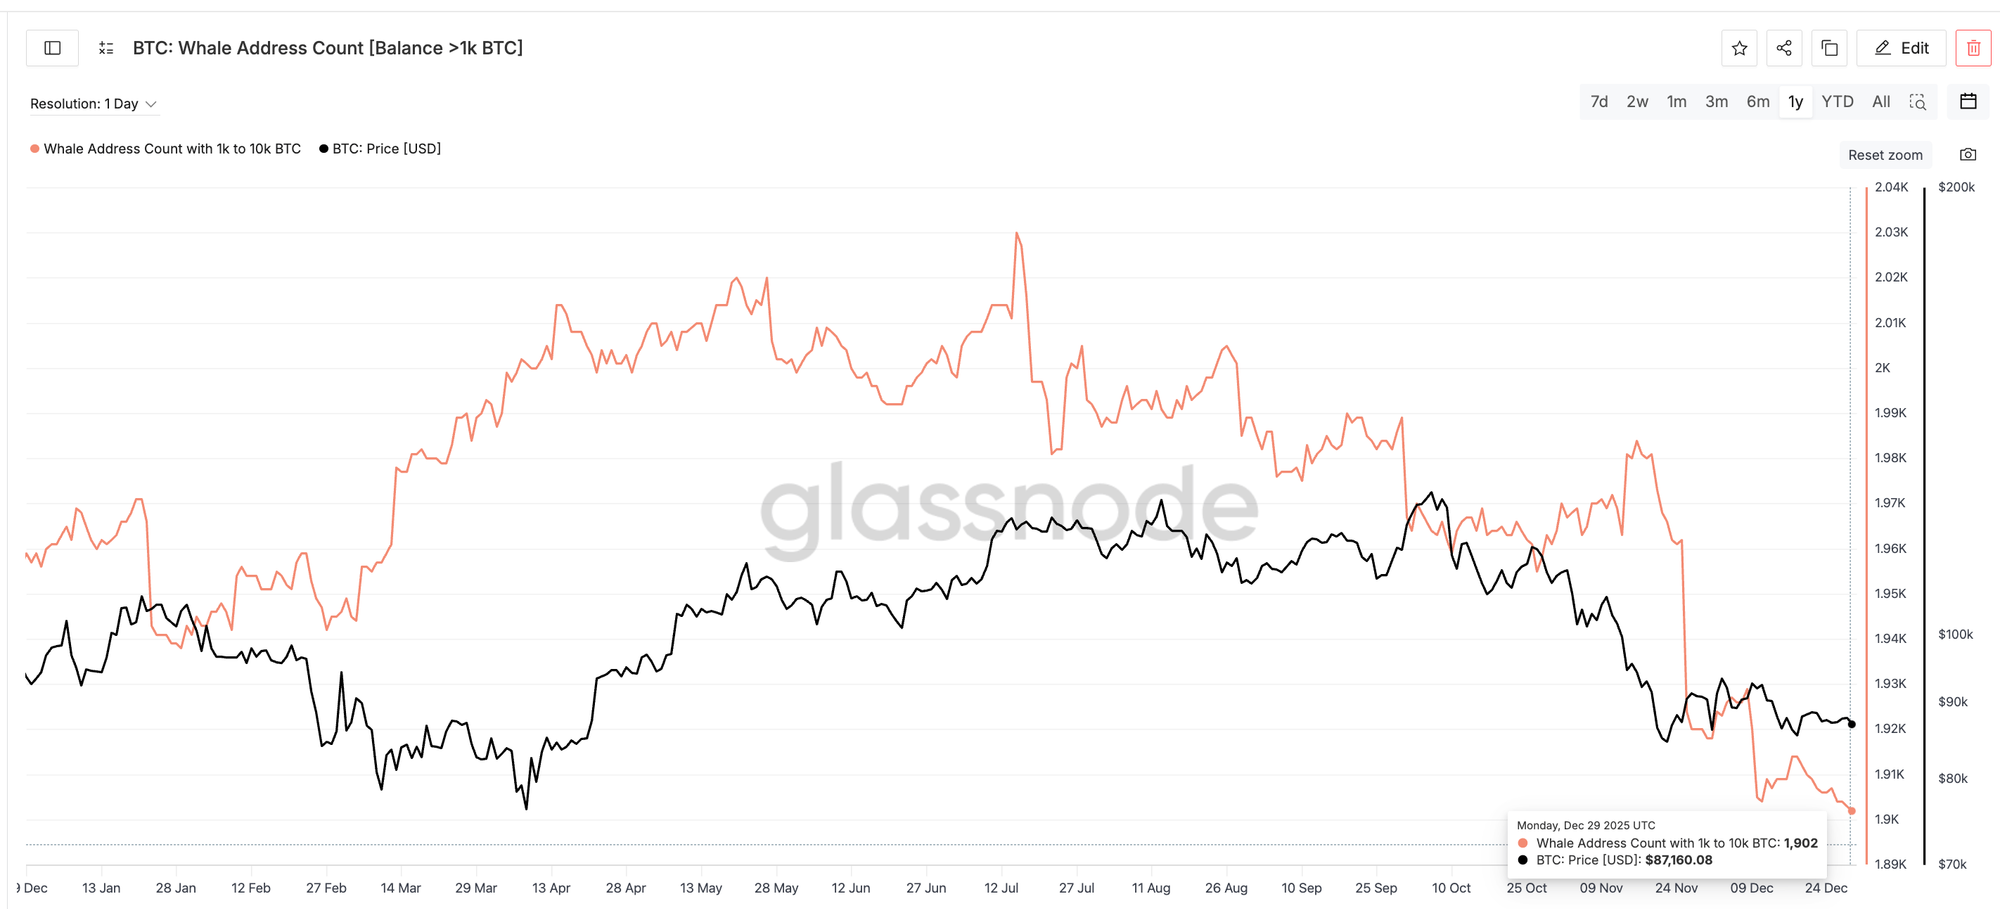
Where Are the Whales?
In April 2025, when small traders panic-sold, the "Whales" (large entities holding 10k+ BTC) and Long-Term Holders stepped in to scoop up cheap coins. They acted as a shock absorber.
This time, the shock absorbers are missing.
According to data from Glassnode, Long-Term Holders have been selling since October 1. While they have recently stopped selling, they aren't buying aggressively either. Their current accumulation is barely 20% of what we saw during the April bottom.
Hunter Rogers, co-founder of TeraHash, explains why this matters:
"Retail still has a late reaction, while whales tend to absorb all the supply during weakness. This pattern keeps playing out again and again."
Without the whales stepping in to fill the gap, the market remains vulnerable. This lack of "smart money" support is the primary reason why the November capitulation signal hasn't sparked a rally yet.
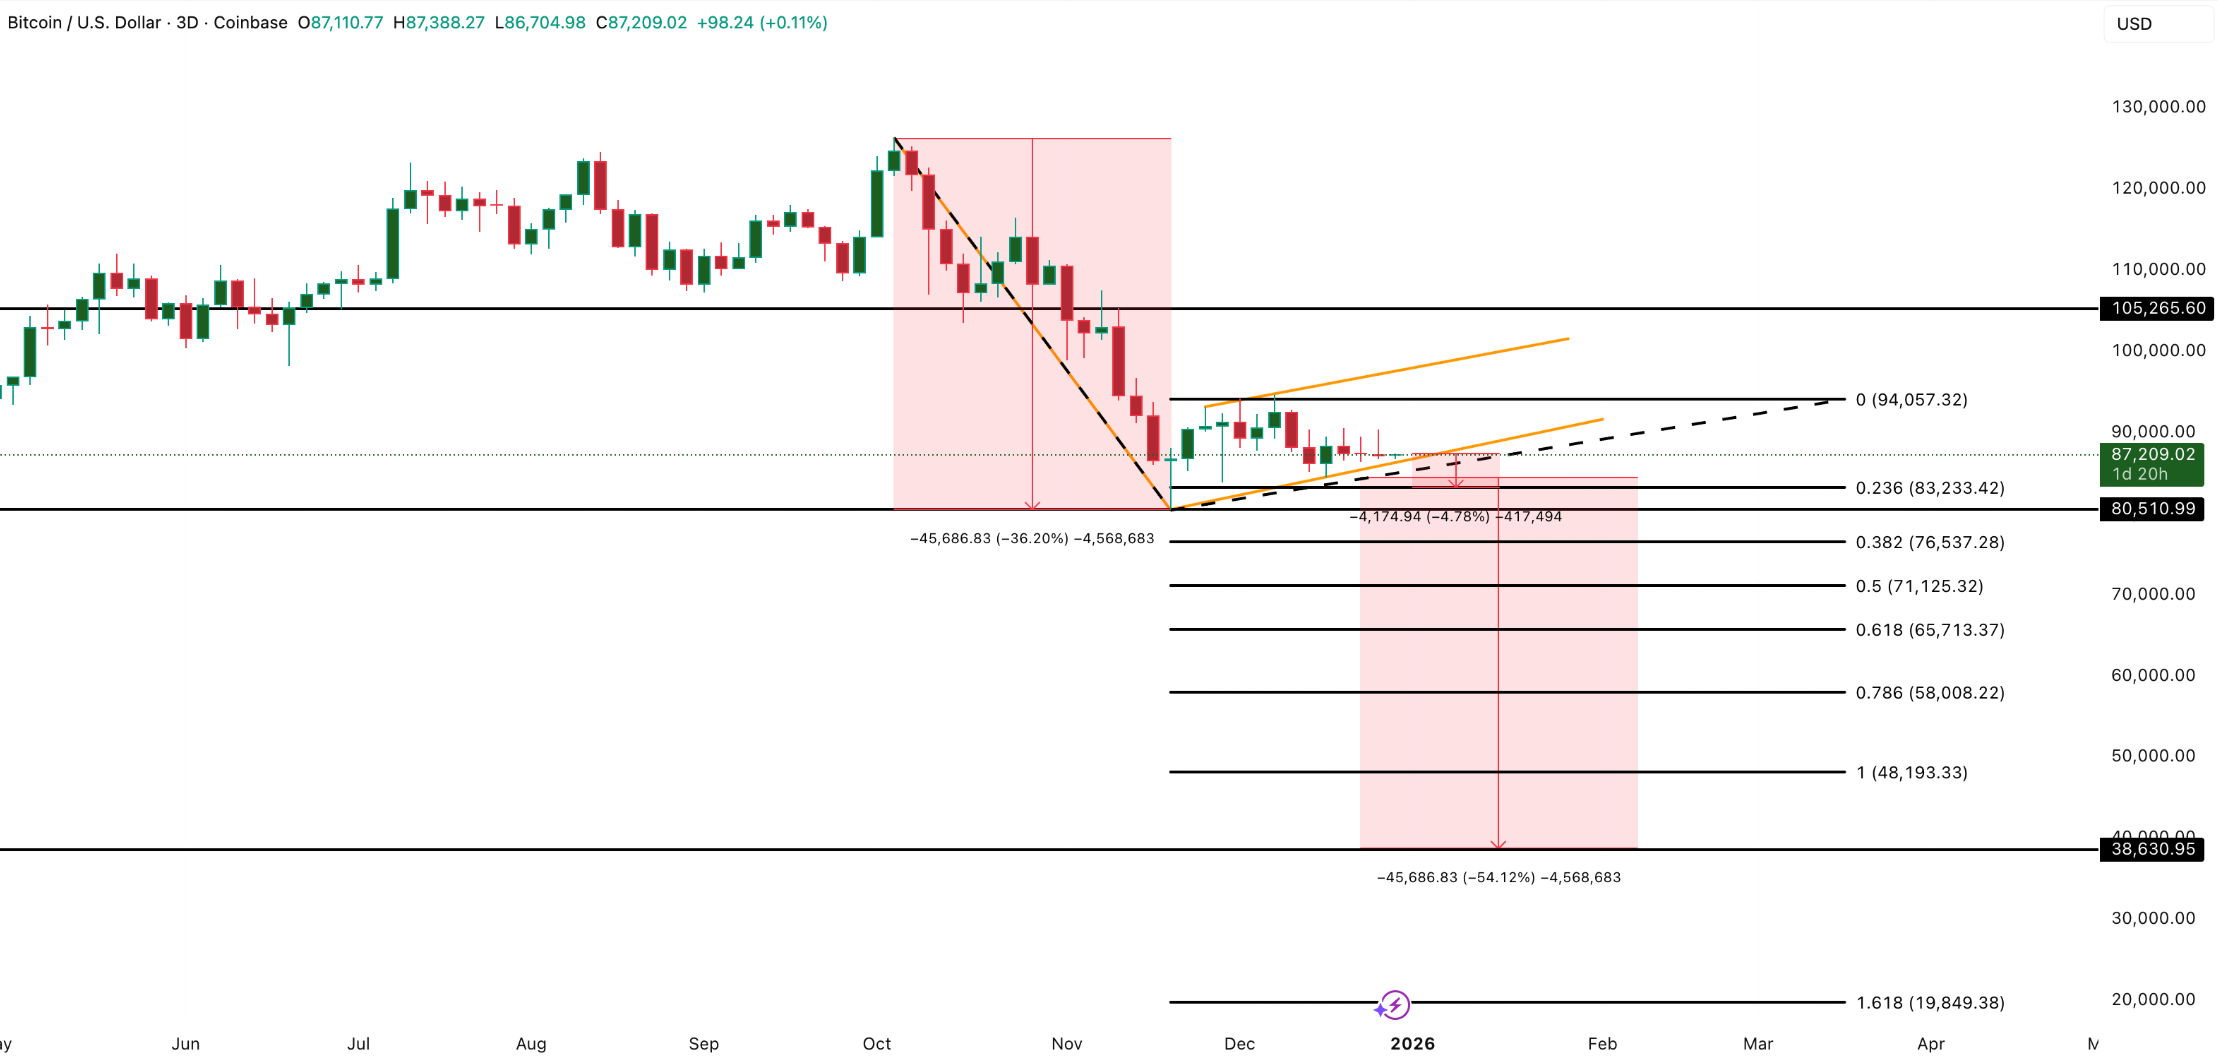
The Chart: A Battle Between $58K and $105K
Looking at the technical charts, Bitcoin is currently trapped in a bear flag formation on the 3-day chart. This is a consolidation pattern that typically resolves with a continuation of the downtrend.
If the price breaks down from here, the measured move could take us significantly lower. The "line in the sand" is the realized price level in the mid-50,000 USD range.
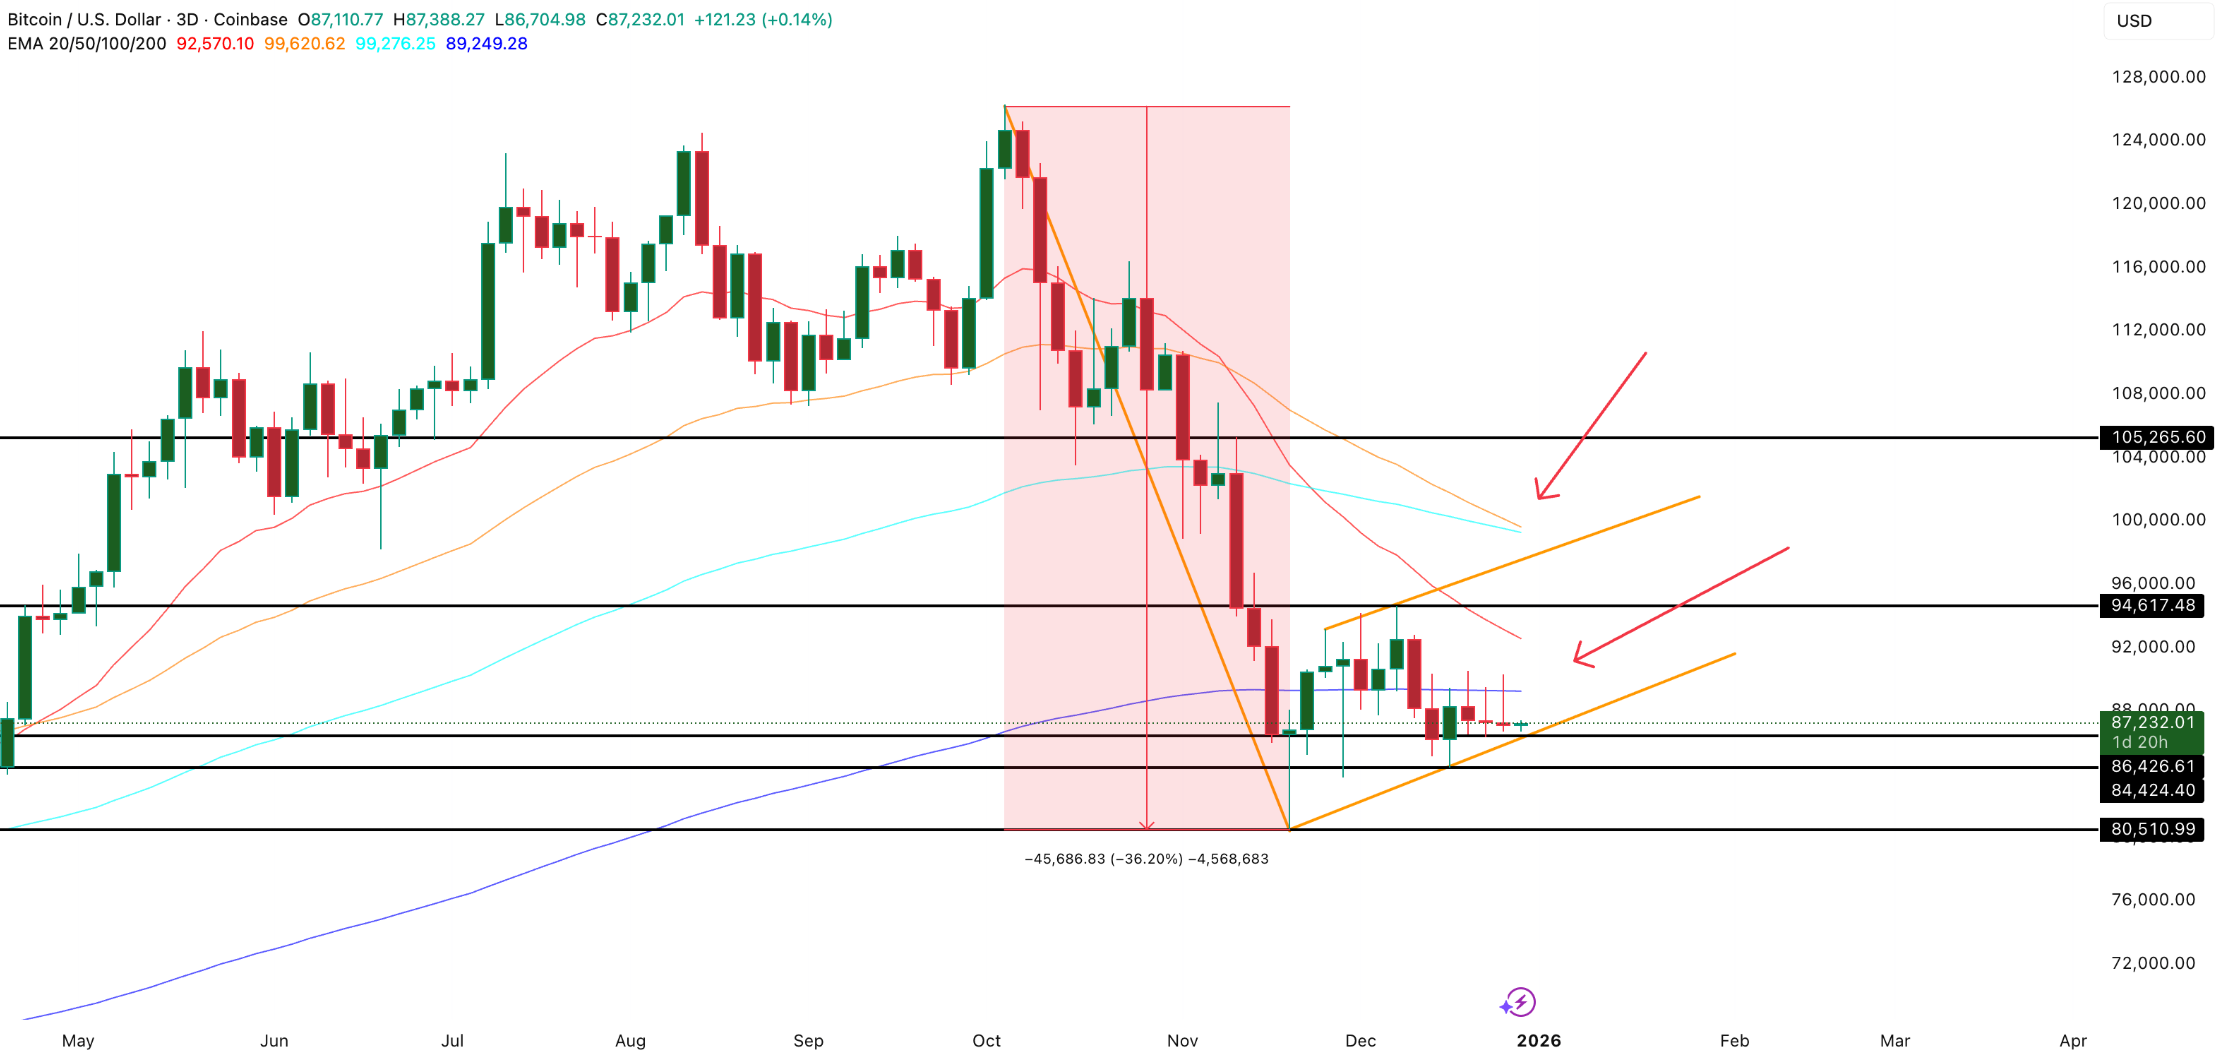
- The Bear Case: If Bitcoin loses the 58,000 USD support level, the market structure breaks. This could force a capitulation event that drags prices down toward 38,000 USD.
- The Bull Case: To invalidate this bearish setup, Bitcoin needs to reclaim 105,200 USD. A move above this level would prove that the current dip was a bear trap, opening the door for a retest of the 126,000 USD highs.
What to Expect in 2026
As we enter the new year, the situation is simple but tense:
- The Bottom Signal is Here: Short-term holders have capitulated, which is historically a precursor to a rally.
- The Buyers are Missing: Whales and long-term holders are waiting on the sidelines, likely spooked by the bearish chart patterns.
- The Trigger: We are waiting for a decisive move. A breakout above 105,000 USD signals a new bull run is starting. A drop below 83,300 USD (and specifically the mid-50k region) warns of a deeper winter.


