

Trading cryptocurrency without a map can feel like navigating a minefield blindfolded. Prices swing wildly, and what looks like a moon mission can quickly turn into a crash landing. However, charts often leave "footprints" before a major trend change occurs. These footprints are called reversal patterns.
If you can spot them, you can exit a position before the market dumps-or enter just before it pumps.
Here is your guide to the three most powerful reversal patterns that signal when the market tide is about to turn.
What Are Reversal Patterns?
A reversal pattern is a specific shape on a price chart that suggests the current trend (whether up or down) is running out of gas. It is the technical equivalent of a driver hitting the brakes and turning the steering wheel.
While "continuation patterns" suggest the market will keep going in the same direction, reversal patterns scream: "Change is coming!"
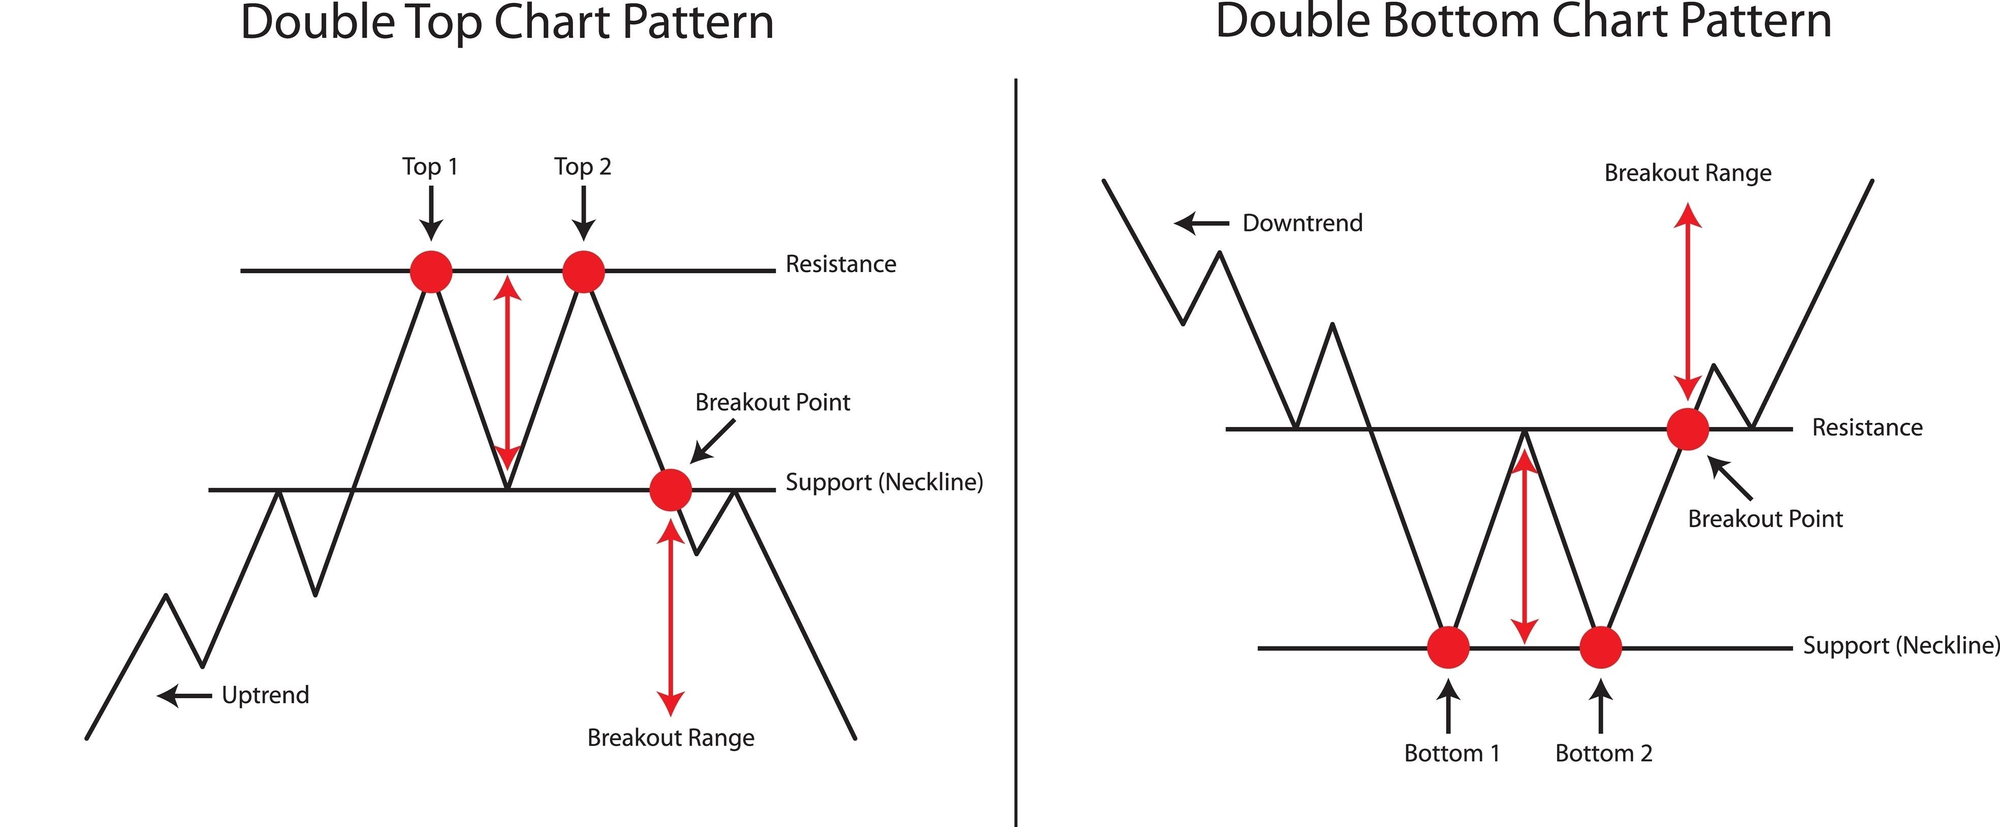
1. The Double Top and Double Bottom
These are arguably the most recognizable patterns in trading because they look exactly like letters of the alphabet.
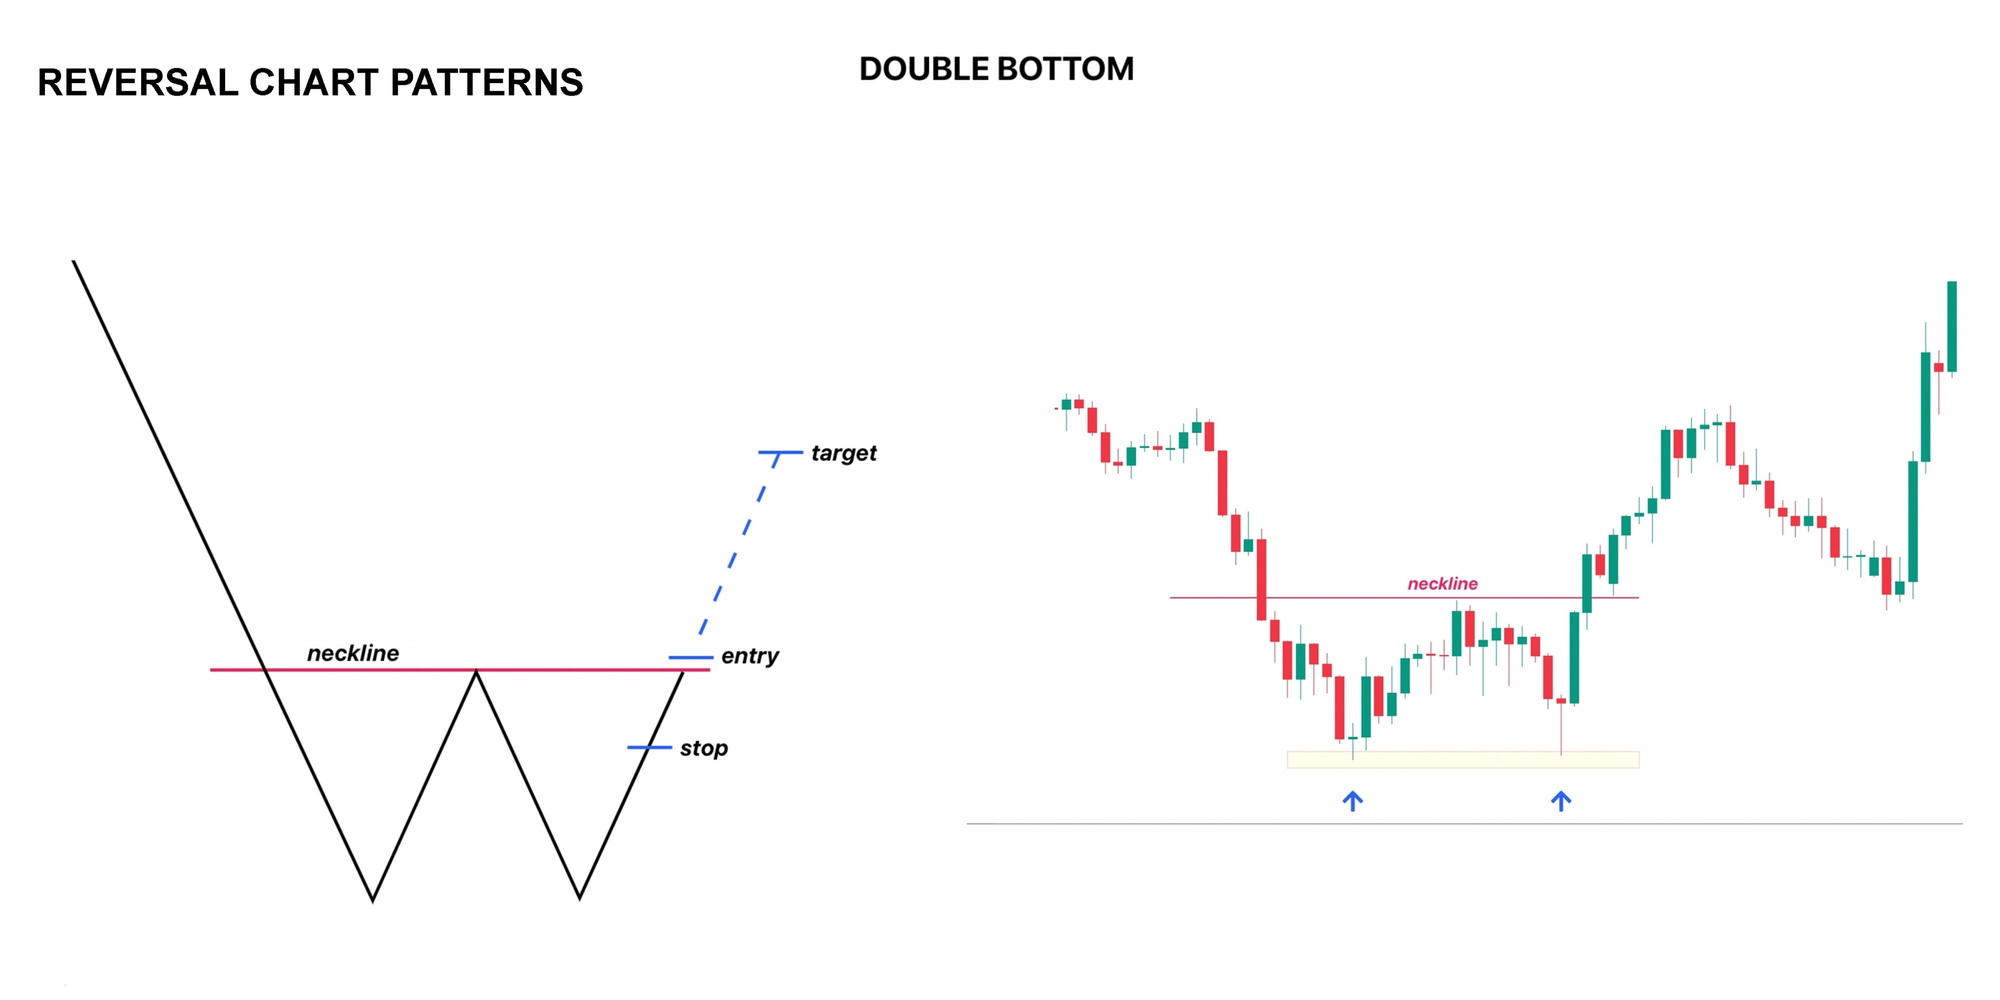
The Double Bottom (The "W") This is a bullish signal. It forms when the price drops, hits a support level, bounces, drops to hit that same level again, and then rallies.
- What it means: Sellers tried to push the price down twice but failed. The floor is solid, and buyers are taking over.
- The Trigger: You buy when the price breaks above the middle peak of the "W" (the neckline).
The Double Top (The "M") This is the bearish twin. The price hits a ceiling, drops slightly, tries to break that ceiling again, and fails.
- What it means: Buyers are exhausted. They couldn't push the price higher despite two attempts.
- The Trigger: You sell when the price breaks below the middle valley of the "M".
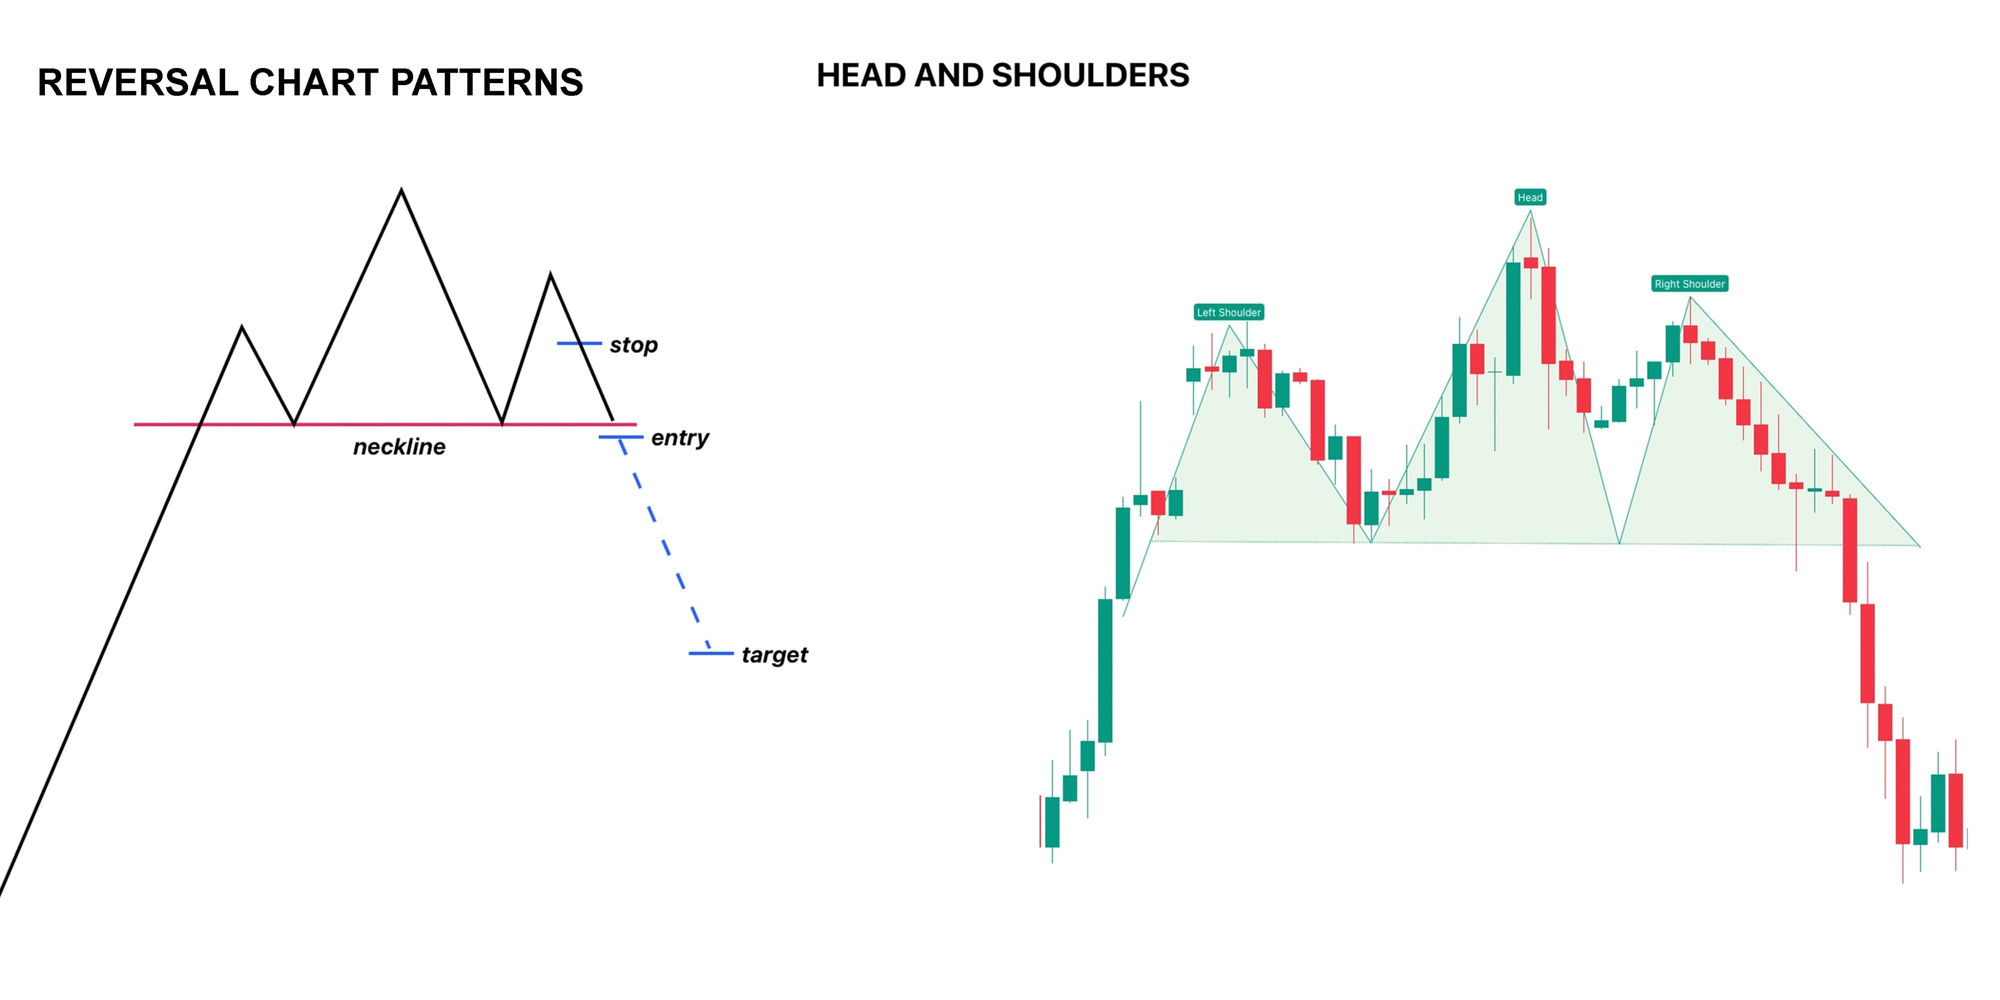
2. The Head and Shoulders
Widely considered one of the most reliable patterns in technical analysis, this formation tells a story of a war between bulls and bears.
The Standard Pattern (Bearish) This signals the end of an uptrend. It consists of three peaks:
- Left Shoulder: A standard price peak.
- Head: A higher peak (the bulls' final strong push).
- Right Shoulder: A lower peak (buyers are too weak to push the price back up to the head).
The Inverse Head and Shoulders (Bullish) This is the same pattern flipped upside down. It marks the end of a downtrend. You see a low, a lower low (the head), and a higher low (the right shoulder).
The Neckline is the key level connecting the base of the shoulders. The pattern is only confirmed when the price breaks this neckline. Until that break happens, it is just a drawing - not a trade.
3. The Adam and Eve
This is a unique and powerful variation of the double bottom (or top). While a standard double bottom has two similar-looking "V" shaped valleys, the Adam and Eve is different.
- Adam (The Spike): The first bottom is a sharp, narrow "V" shape. It often happens on high volume, representing a panic sell-off and a quick bounce.
- Eve (The Bowl): The second bottom is a wide, rounded "U" shape. The price moves slower here.
Why it matters: The "Adam" spike shows extreme volatility and fear. The "Eve" rounding shows the market stabilizing and building a base. When the price finally breaks out after the "Eve" formation, the move is often explosive because the market has had time to consolidate.
A Critical Warning
Identifying these patterns is only half the battle. The most common mistake beginners make is anticipating the pattern before it finishes.
- Wait for the breakout: A Head and Shoulders is not a sell signal until the neckline breaks.
- Check the volume: Reversals are stronger when they happen on high trading volume.
- Manage Risk: Even the best patterns can fail. Always use a stop-loss.


